wondering if anyone is familiar with the TTM SQUEEZE INDICATOR created by John carter from simpler options.
The nature of this indicator is the bollinger bands set at 20 days with 1.5 stddev and Keltner channels with 20 and 1 stddev and the momentum oscillator on 14 days .
When the bollinger bands contract together in to the Keltner channel and then break out of the Keltner channel it is said that the squeeze has fired and the momentum histogram shows the direction of the move up or down.
I managed to find a functioning version of this indicator on Tradingview platform,however i would prefer to build this indicator to use on Optuma.
The script is also available on tradingview however the script language is not the same as the Optuma language.
This indicator is very useful and much easier on the eyes than plotting all three tools on the charts.
Here is an image and also a link of what it does exactly.
Thank you for your post. I’ll have a look at the rules and examples in your post and will see if it can be setup as a script. If it can i’ll post an example here.
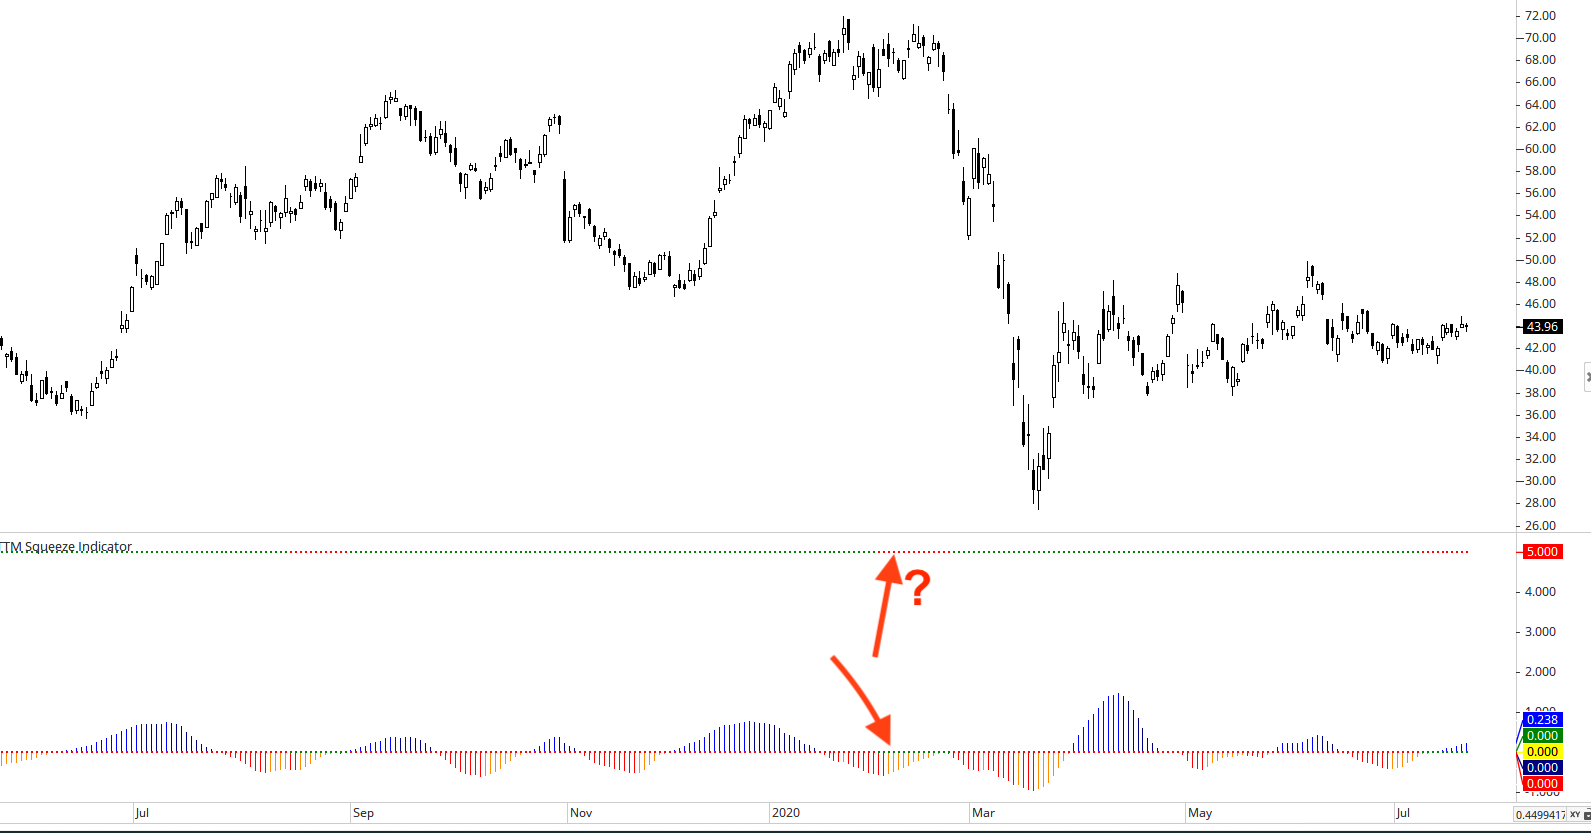
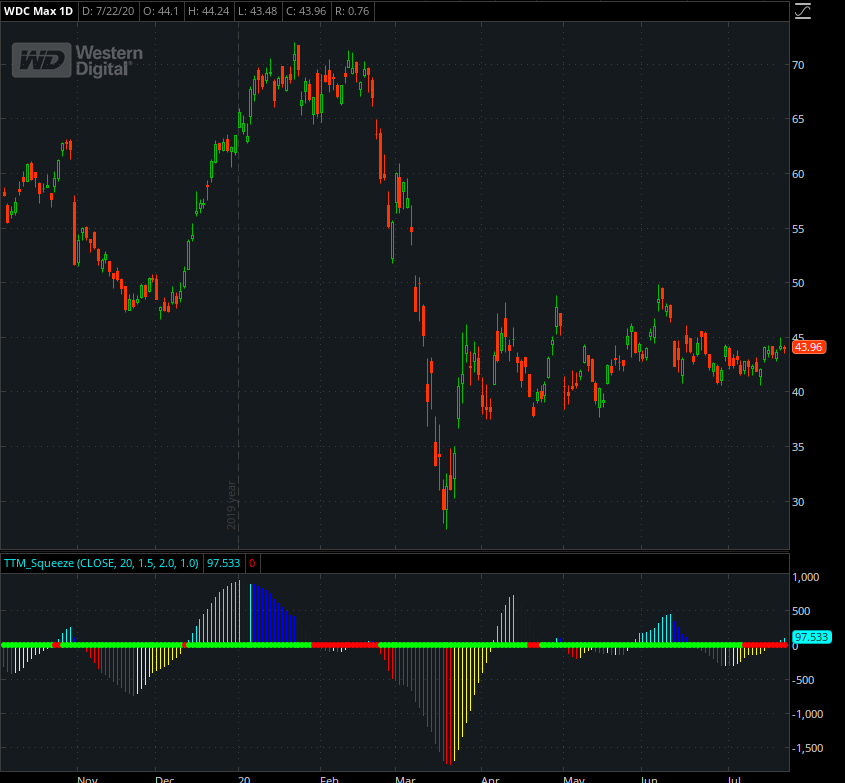
I don’t understand what that line at the top of the indicator window is. It also kind of pushes the oscillator down making it small in size. In certain cases the oscillator cannot be seen at all. (This is the WDC daily chart. The second one is the original daily chart from Think-or-Swim.).
They are hard coded to use a value of 5 which works fine for the DAXX (the original chart the script was built on) but not for WDC as the values of the indicator are much smaller.
Changing the values from 5 to 0.1 in the case of WDC will adjust the code to display as expected.
Thank you, Matthew!
I still do not understand why this extra line exists. I can see that the red/green areas are just the opposite of those of the zero line.
Can this extra line be placed over (instead of) the zero line? Or simply change the red/green areas of the zero line and delete this extra line?
Thank you again.
Julius
I have tried to copy the above script and place it in the show view tool, but it is not reading it as a valid script. Have I missed a step? See attached.
Did you copy the code from the forum into Notepad first, then copy the code from Notepad into Optuma?
If you copied it directly from the webpage, there could be some special characters included in the copy that prevent the script from working. By copying the script into notepad first, these special characters are removed, which should allow the script to work.
I am not sure why the copy past option isn’t working for you. I’ve attached a copy in a workbook, please try opening it up and the indicator should show along the bottom of the chart.
From there you should be able to save the script to your script manager / tool bar.