This thread is for charts posted on twitter.com/Optuma
To calculate the returns for the first 3 days of each month: https://twitter.com/Optuma/status/1577984492488343552
//Calculate required period rate of change;
V1=ROC(BARS=3);
//Month change trigger;
M1=MONTHNUM() <> MONTHNUM()[1];
//Set M1 offset to the end of the previous month, ie [2] for 3 days, [3] for 4, etc;
IF(M1[2],V1,HIDDEN())
So to calculate for the first 5 days of each month V1 should be changed to ROC(Bars=5) and the M1 offset in the last line to [4].
Hi Darren,
In your Twitter tweet https://twitter.com/Optuma/status/1583433417974243328?cxt=HHwWgICzvbyTvvkrAAAA you wrote: “9.6% of US listings made a new 52 week intraday low yesterday (12.4% of NYSE & 7.7% of Nasdaq).”
How did you get the value 9.6% when 12.4% of NYSE and 7.7% of Nasdaq stocks made new 52-week lows?
Thank you and best wishes,
Thomas
Hi Thomas,
This was calculated using breadth data from DTN IQFeed.
//Sum NYSE & Nasdaq 52 week lows;
N52L = (FINL.Z:IQInd + FIQL.Z:IQInd);
//Sum NYSE & Nasdaq total listings;
TOT = (IINT.Z:IQInd + IIQT.Z:IQInd);
//Calc %;
(N52L/TOT)*100
For Thursday there were 4,843 listings on Nasdaq, and 3,310 on NYSE, for a total of 8,153. With 784 new 52 week lows (374 on Nasdaq and 410 on NYSE) we get 784 / 8153 = 9.6%.
For the individual exchanges you could use our breadth data (NYSE52WL and NASDAQ52WL), but we don’t have the total number of listings to calculate the combined percentage.
Hi Darren,
You have again published an interesting chart about the December seasonality on Twitter ( https://twitter.com/Optuma/status/1598343500952649728?cxt=HHwWgICytcO8uq4sAAAA ).
I have figured out the script that does the counting of the number of positive and negative December returns:
Line1 = MONTHNUM() == 12 ;
Line2 = CHANGE() ;
Line3 = IF(Line1 == 1, Line2, HIDDEN()) ;
Line4 = IF(Line3 >= 0, 1, 0) ;
Line5 = ACC(Line4) ;
Line5
So far so fine. But I have a data history of the S&P 500 going back to 1885 so the above script calculates the number of positive Decembers going back to 1885.
Using the chart property setting “Date Range” and select “Selected Date” and setting the start date of the chart to 01/01/1950 the above script calculates of course the number of positive December returns since 01/01/1950.
But is there a way set the start date of the calculation beginning 01/01/1950 in the above script?
I have worked with the “Look Back Period” settings in the “ACC” function, but when I enter a fixed number of years looking back the current year calulation is correct but not the past years.
Line5 = ACC(Line4, RANGE=Look Back Period, BACKTYPE=Years, BARS=73) ;
I have worked with the “BarDate and StringDate Functions” but without success.
Start = BARDATE()==STRDATE(DATE=1949-12-31);
So I need again your help to figure out how to set the start date of the calculation to 01/01/1950.
Best wishes
Thomas
Hi Thomas,
Try this on a monthly chart:
V1=MONTHNUM()==12 and CLOSE() IsUp;
ACC(V1, RANGE=Look Back Period, BACKTYPE=Date, STARTDATE=1950-01-01)
Show Bar labels: https://twitter.com/Optuma/status/1625454807833284614?s=20&t=9E9H46kkIglnMWXV1VjWmw
To show the monthly range % on each candle:
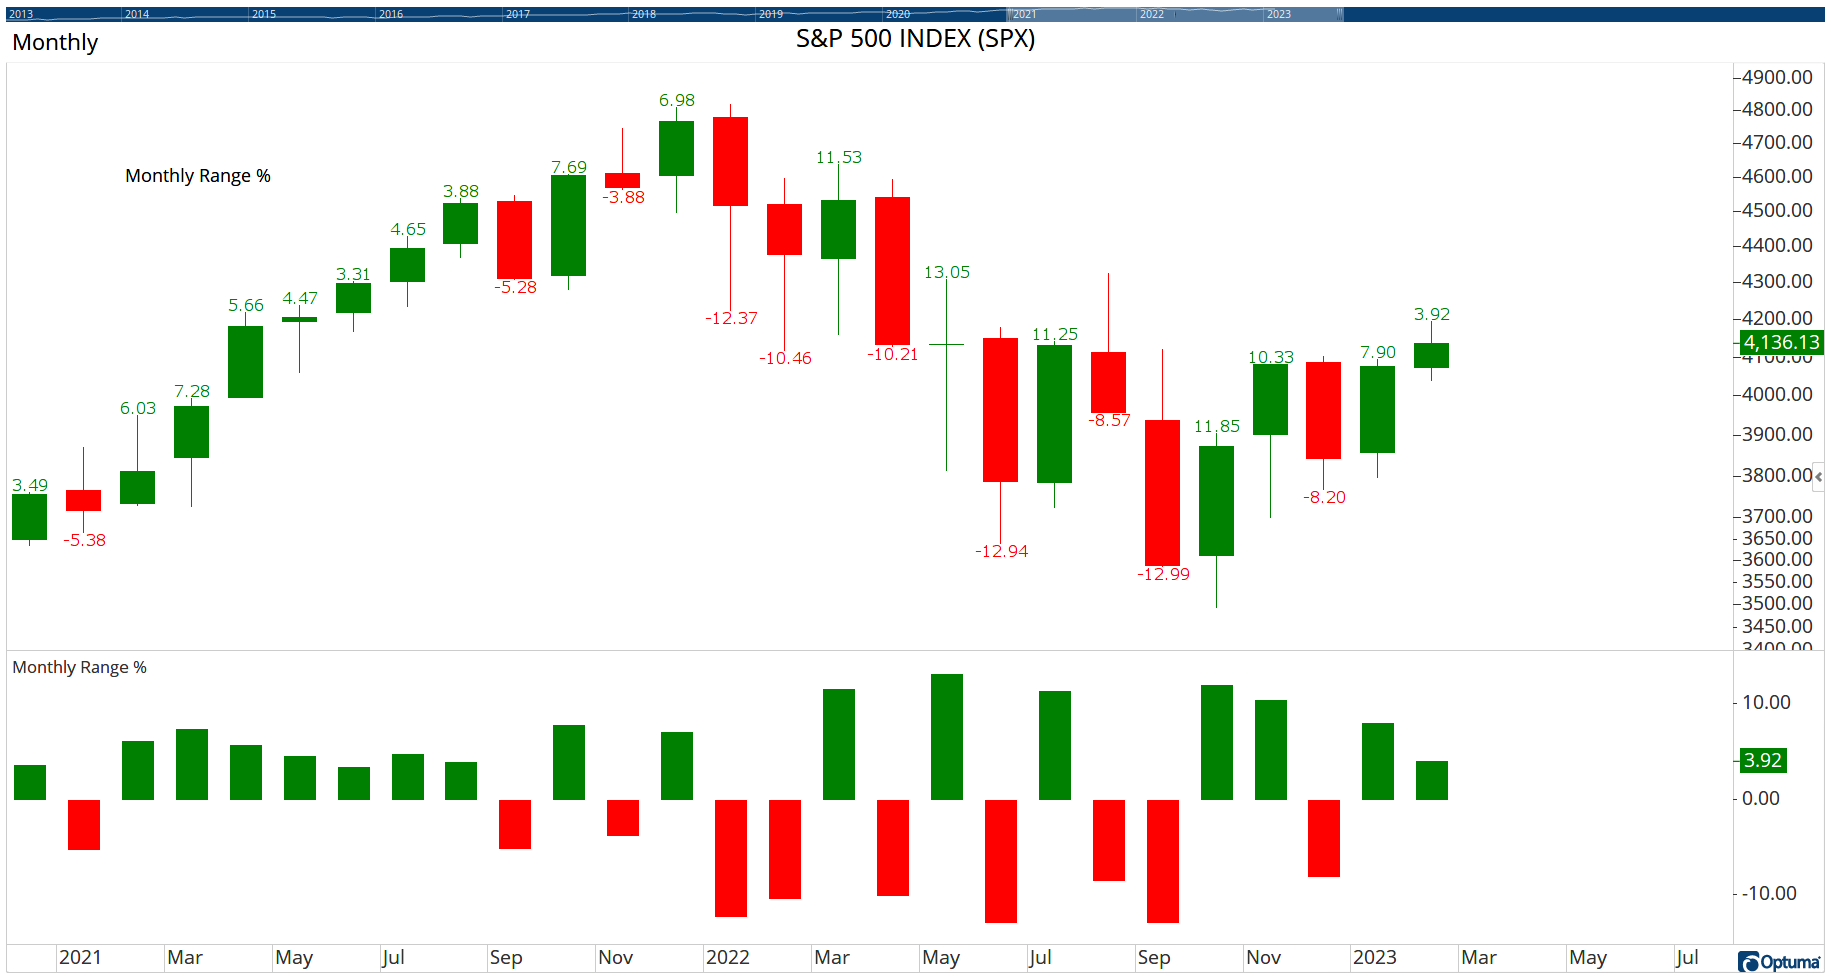
For the green labels, use the following as a Show Bar set to display as a Number:
R1=(HIGH()/LOW()-1) * 100;
IF(CLOSE() IsUp, R1,0)
For the red labels, add a second Show Bar and change the Position to Low and use the following:
R1=(LOW()/HIGH()-1) * 100;
IF(CLOSE() IsDown, R1,0)
For the histogram below the chart use the following in a Show View:
R1=(HIGH()/LOW()-1) * 100;
R2=(LOW()/HIGH()-1) * 100;
IF(CLOSE() IsUp, R1,R2)
Optuma clients can save and open the attached workbook as an example.
Show-Bar-Labels.owb (15.8 KB)
Hi,
I am interested how I can make Russell 3000 breadth thrust indicator that was used in today’s Twitter tweet.
Regards, Pentti Rahko
Hi Pentti,
The Breadth Thrust measure will be in our new Breadth Data which will be released to clients in the coming weeks. It will include these 50 measures for major global exchanges, including Russell 3000, FTSE 350, NIFTY 500, and the EuroStoxx 600.

We’ll be announcing when this data will be available soon!
Hi Optuma team,
you posted on Twitter a chart with the sector weights ( https://twitter.com/Optuma/status/1661135632633331712?cxt=HHwWgIDUrdGDxY0uAAAA ).
Here is the chart:

I use Optuma v2.1 Beta Build 97 and so I am able to get the sector weights.
The scripts for the sector weights are easy ( https://help.optuma.com/kb/faq.php?id=1269 ).
What causes me problems to replicate is the issue that you have empty cells when a stock is not a member of the sector. In my script I get for the stocks that are not members of a sector the value “0.00”.
I tried the following script to get empty cells for non-members but failed:
Line1 = ISMEMBER(SYMBOLLIST=NASDAQ 100) ;
Line2 = WEIGHT(SYMBOLLIST=QQQ - Invesco QQQ Trust) ;
Line3 = IF(Line1 == 1, Line2, HIDDEN()) ;
Line3
Please inform me what script you used to get empty cell values for non-members of a sector.
Best wishes,
Thomas
Hi Thomas - there’s a bit of a trick in the formatting of the columns. The script is simply WEIGHT(SYMBOLLIST=QQQ - Invesco QQQ Trust) and once added right-click on the column header and change the Column Type to Percentage. Under Custom Labels put a blank space for the label and set ==0 to white:

Thank you Darren,
A really nice trick with the blank space for the label. I have worked with the Custom Labels property but the idea of the blank space did not occur to me.
Perhaps a small improvement:
If you choose the colour black instead of white, the default row colour formatting in the watchlist is maintained.
Thanks,
Thomas
Hi Optuma-Team,
On Twitter (https://twitter.com/Optuma/status/1685098785444392960) you posted the following chart:

How did you script the horizontal dotted line corresponding to the current last value to go back only to the last occurrence that also corresponds to the current last value?
Thanks,
Thomas
Hi Thomas,
There was no scripting involved with those horizontal lines - I manually drew them on the charts!
1% moves: https://twitter.com/Optuma/status/1686868142323269640?s=20
Since +1% move in a Show View with Plot Style set to Dot:
C1 = CHANGE() >1;
TIMESINCESIGNAL(C1)
Since -1% move in another Show View:
C1 = CHANGE() <-1;
TIMESINCESIGNAL(C1)
Drag the bottom Show View layer into the first Show View using the Structure Panel and rename the layers:

The bottom is similar with 2 Show Views counting the yearly totals. The formula for the number of +1% days using the ACCSINCESIGNAL() function when the YEARNUM() changes:
V1=CHANGE()>1;
V2=YEARNUM() IsUp;
ACCSINCESIGNAL(V1,V2)

Hi Darren,
Can you please publish here in the forum the workbook you have shown on Twitter (https://twitter.com/Optuma/status/1702083087956648304) or at least the scripts to count the days an item is making a relative high or low.
Many thanks,
Thomas
Hi Thomas,
Use the following to count how long since the RIC() value was this high:
D1=RIC();
TIMESINCESIGNAL(D1>LAST(D1), Unit=Bars)
Change the variable D1 to use any other indicator, eg Close, RSI, Volume. Change the sign in the TIMESINCESIGNAL function to find the low, eg today was the lowest volume in 13 days for TSLA (since August 25th). To show the date (change the Column Type to Date):
D1=VOL();
BARDATE((D1<LAST(D1), Unit=Bars))

Hi Darren,
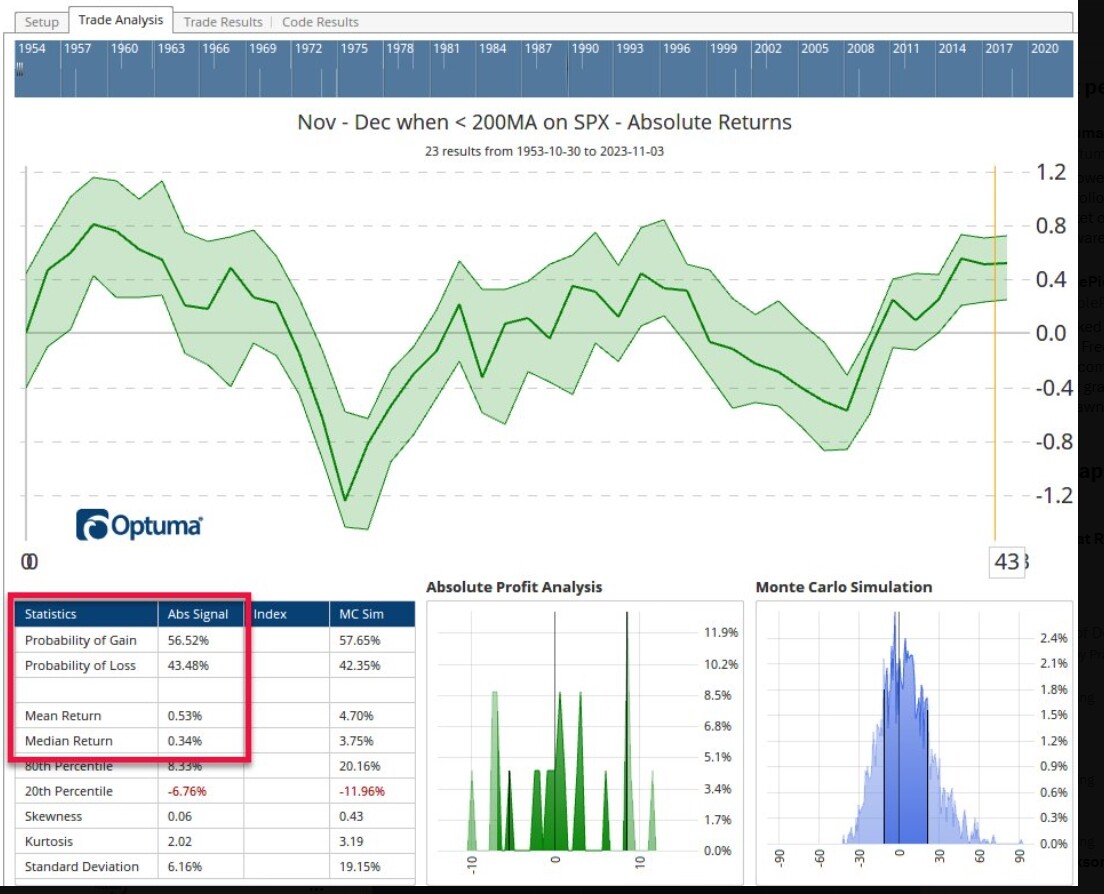
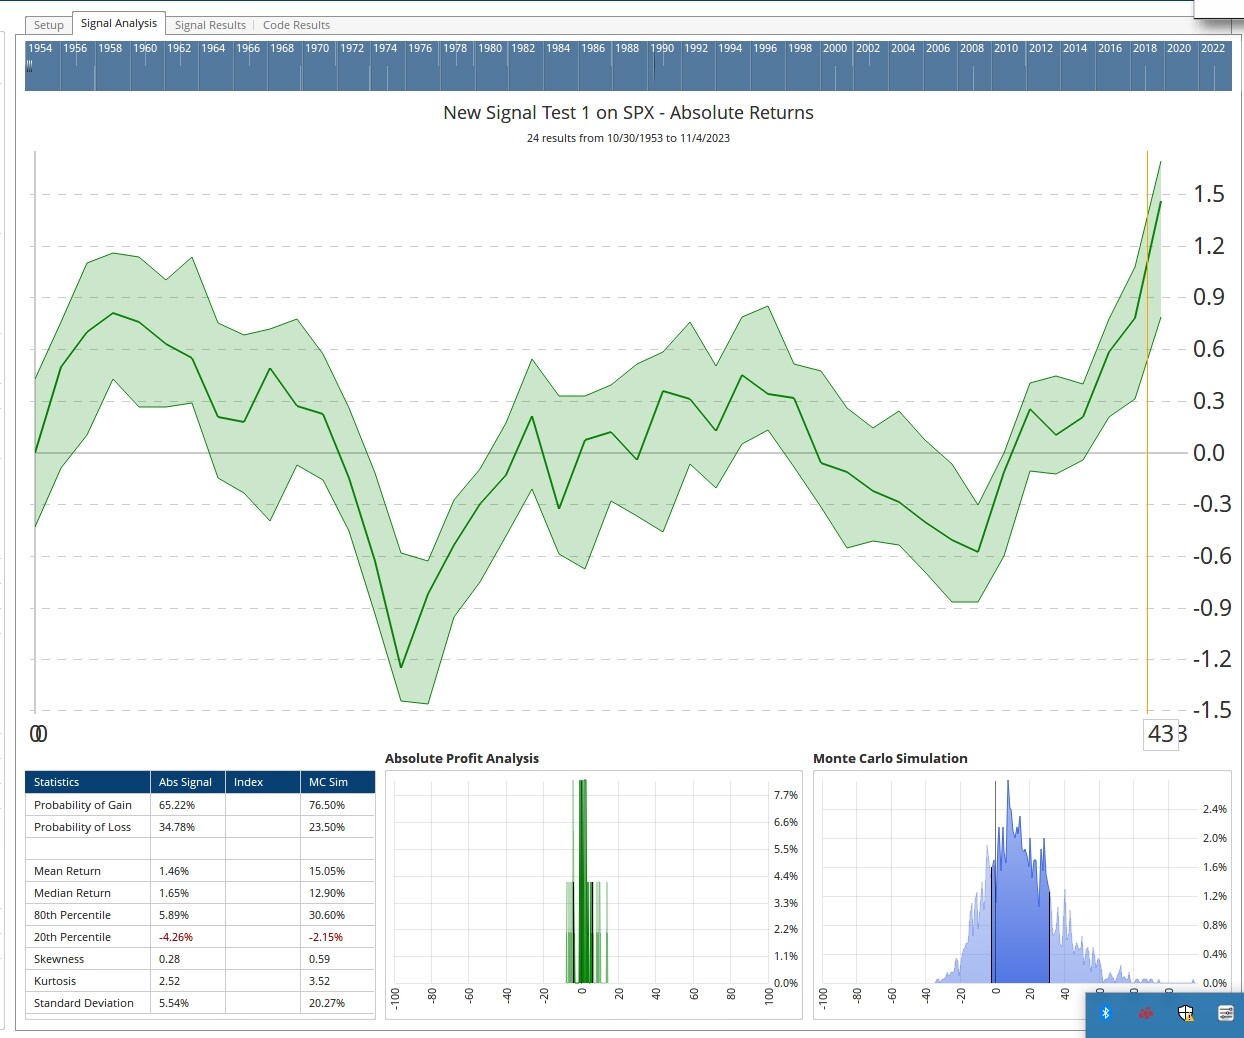
I was trying to recreate your signal on Nov - Dec results when the spx is under 200ma at the end of October… I got close results to yours, but different; curious what script you used? Here is what I did below and my screenshot is attached vs yours
//Start signal - enter trade at the close of last day of October

a1 = MONTHNUM() ChangeTo 11;

a2 = OFFSET(a1, OFFSET=-1);

//Close is below 200ma

b1 = MA(BARS=200, CALC=Close);

b2 = CLOSE() < b1;

a2 and b2
Hi Darren,
Could you please also publish the script from your Twitter analysis about the performance of Nov and Dec when Aug, Sept, and Oct have all been down.
https://twitter.com/Optuma/status/1719940509945434534

Thanks and best wishes,
Thomas
Hi Thomas,
Darren is currently out of the office this week, he will post the workbook and script once he has returned.