In a watchlist, when I add the “standard” built-in script for “Last”, it will show me live extended hours pricing in a column… However when I want to use a custom script that is trying to reference the current price using “Last()” , it is using the day’s close versus the live after hours price. Is there another way to go about this?
Simply what I am trying to do is create a column that will show the percentage a stock is up or down in extended hours in relation to its daily close ( will display that “XYZ stock is up 5% in post/pre market”).
When the time frame of the watchlist is set to “1 day”, CLOSE() or LAST() populates the close of day price and but then there does not seem to be a way to retrieve the after hours price using those variables with the watchlist in “1 day” mode. Now, if the watchlist is set to an intraday timeframe ( “60 minutes” for example), when I use CLOSE() or LAST() in a script, it will retrieve the extended hours pricing, but then in the intraday set watch list, I can’t seem to then retrieve the day’s close price using those variables, even if they are specified for daily timeframe, ex: a1 = CLOSE(Day(PERIODAMOUNT=1));
The time frame will have an impact on which Close() references. To achieve what you are wanting to do i think you’d need to setup a script that splits the bars into In Session and Out of Session zones. Once you have done that you can then select specific bars within those zones to use in your comparison to see how much the price has moved in extended trading.
This is a useful script, thank you for sharing - I like how I can shade extended hours and change the color of the time periods, however, I am still a bit confused on how to use these variables that contain decimals to call up the end of day and a live extended hours price quote. Can you give me an example how to reference the close using decimals and the current extended hours price? I tried to nest some of the variables inside of close and last and it didn’t query the price
I’d setup a 15min watchlist and use a variation of the script i referenced earlier to find the price when the out of market hours ends to compare with the main sessions close.
To do this you’d use the PriceatSignal() function, but for that to work you need to set a Boolean trigger to mark when the out of session zone starts and ends. That will give us the price points which we can then use to calculate the % difference between.
The final script would look like this:
//Find the full bar date with intraday decimals
V1 = BARDATE() ;
//Find the daily bar date, without decimals
V2 = ROUND(V1, DECIMALTYPE=0) ;
//Reduce bar date to intraday range only
V3 = V1 - V2;
//Identify Out of Session Range
V4 = (V3 < 0.395555) and (V3 > -0.333);
//Find Closing Prices at End of Session and End of Of Out of Session
V5 = V4 CrossesAbove 0.5;
V7 = V4 CrossesBelow 0.5;
V6 = V5[-1];
V8 = V7[-1];
RES1 = PRICEATSIGNAL(V6);
RES2 = PRICEATSIGNAL(V8) ;
//Calculate % Gain or Loss
FNL = 100 * (RES2 - RES1)/RES1;
//Show Result
NONZERO(IF(V7 == 1, FNL,0))
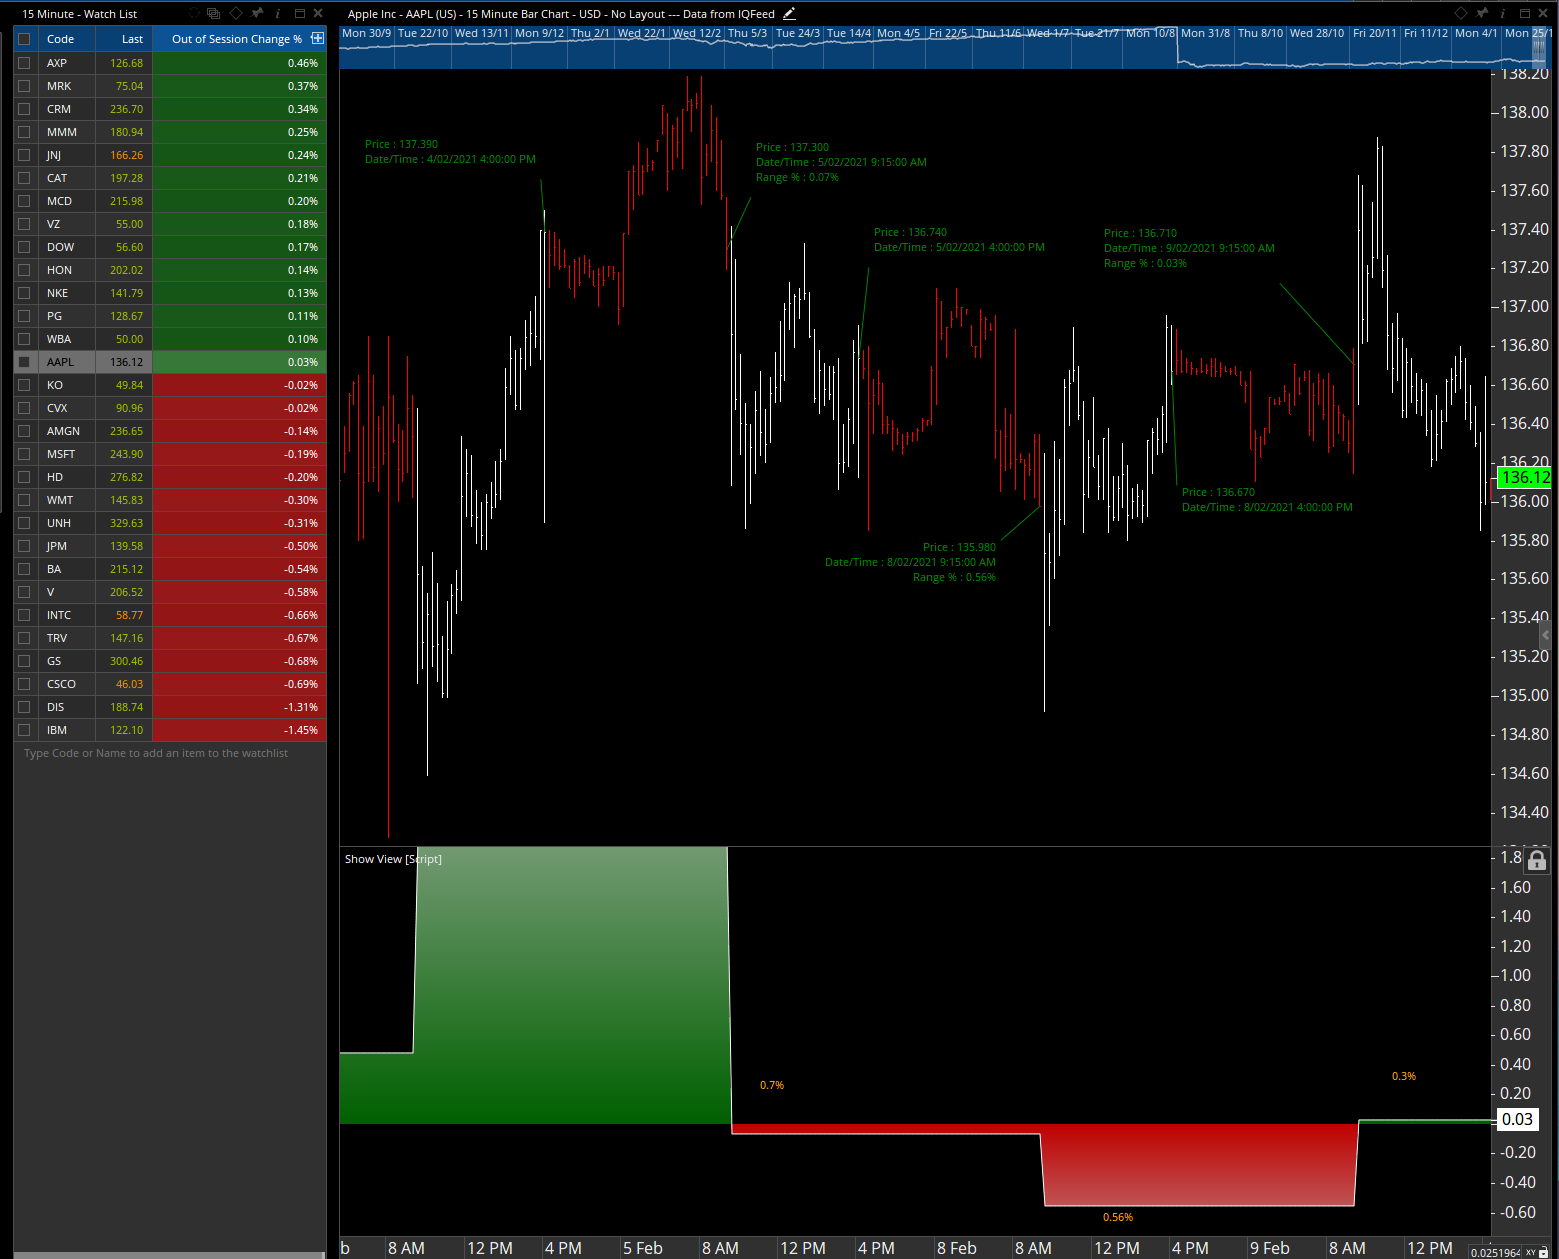
You can see how the Show View displays the % change each day, comparing the close of the main session with the close of the out of session activity. The values line up with a manual measurement of the same ranges.
I’ve attached an example workbook (which uses live USA Equities data) for you to review. It may not be exactly what you are after but should give you a foundation to build on.