I'm trying to test a model based on change in slope of a short-term and mid-term MA's as a buy condition with a sell based on a LT MA.
How do I script that both MA conditions have to be met in order to trigger a buy? Individually, they have many more buys than they do combined. Next, I only want the first buy trigger and then the first sell trigger to be used. Is there a way to specify these conditions?
What would be the entry condition? You could say when the 50MA is sloping up and and the 12EMA TurnsUp - in other words when the medium trend is up and the short term resumes up after a pullback.
You can create the following boolean conditions which give a value or 1 when true and 0 when false. By adding the results together then the entry will be when the total is 2, or when both conditions are true:
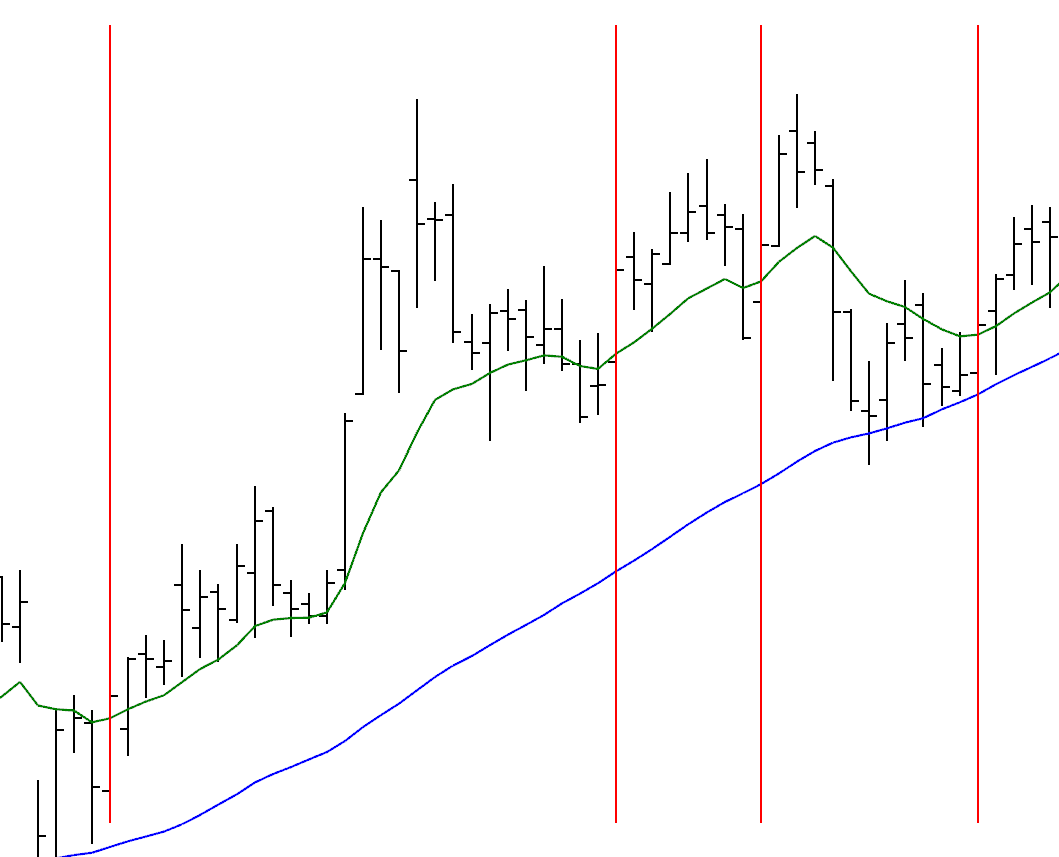
Add that formula to a Show Bar to verify that it’s doing what you want it to do. In this example the red lines show when the blue 50MA is trending up and the green 12EMA resumes upwards after a downturn:
With regards to the entries and exits in the backtester, if you set the criteria in the Test Rules to 100% of equity with a max position of 1 it will only take the first signal after each exit:
Thanks Matthew, that's sort of the idea. However, as I learned, you have to be more specific about what constitutes a change in slope. So, I have one condition for the 20MA which looks like this
m1 = MA(BARS=20, CALC=Close);
h1 = LOWESTLOW(m1,BARS=10);
c1 = (m1 - h1) / m1 * 100;
c1 CrossesAbove .50
The script for the shorter term, 10MA, is basically the same. So, how would I write the formula to identify those conditions both being met, as you described?
Just to follow up on the previous post, that will only trigger when both MAs cross 0.5 on the same day, which isn’t very likely. As such, to trigger when either one crosses 0.5 (and the other one is already above 0.5) change the last 3 lines to this:
//Signal when MA change > 0.5% from low
RES1 = c1 > 0.5 and c2 CrossesAbove 0.5;
RES2 = c2 > 0.5 and c1 CrossesAbove 0.5;
RES1 or RES2
Darren, Thank you for that last suggestion. That definitely helped. Now, the last thing I'm trying to add combines a weekly close below one moving average, say 20MA, and a slope of another moving average, like 40MA, is downward. How would I apply that in a similar fashion so that it doesn't have to be a simultaneous occurrence?
It gets a bit complicated when using weekly data on a daily chart, but you could do something like this (assuming the MAs are also weekly):
v1 = CLOSE(Week(PERIODAMOUNT=1))<MA(Week(PERIODAMOUNT=1, BARS=20, CALC=Close) and MA(Week(PERIODAMOUNT=1, BARS=40, CALC=Close) IsDown;
(RES1 or RES2) and v1
Thanks Darren, but I don't quite understand the last suggestion. You suggested using (Res1 or Res2) but didn't specificy what those conditions would be.
Also, I have been testing the previous scripting conditions combination
Sorry Brad I thought your question was adding the condition to the previous script which included RES1 and RES2… if it’s a different one you could do something like this to trigger when the close crosses below the 20MA when the 40MA is sloping down:
CLOSE(Week(PERIODAMOUNT=1)) CrossesBelow MA(Week(PERIODAMOUNT=1, BARS=20, CALC=Close) and
MA(Week(PERIODAMOUNT=1, BARS=40, CALC=Close) IsDown
Note: if using this in a Show Bar on a weekly chart or a scan set to use the data timeframe of 1 week then you don’t need to specify the timeframe in the script.
CLOSE() CrossesBelow MA(BARS=20, CALC=Close) and
MA(BARS=40, CALC=Close) IsDown
As for the issue with getting more results with the RES1 or RES2 rather then using just one, there are more chances of getting a trigger when using 2 scenarios rather than just one. Put the various formulas as separate Show Bar tools (change the colours to differentiate) and you will see why they trigger.
Darren, thanks for the response and clarifying that. However, as we have learned, using the criteria like MA(BARS=40, CALC=Close) IsDown doesn't mean that the slope is down but simply that it is lower than the previous close. That's why we created a criteria that compares it to its recent highest high for the MA, such as
I'm still hoping some help to try to resolve this issue I've been having trying to get the script to reflect the output I can visually see. I want to test a sell signal that triggers when the weekly close drops below the 20MA and the slope of the 40MA is also down. Another way of looking at this condition would be the weekly close is under the 20MA and the slope of the 40MA turns down. The problem is that the standard scripting language of "turns down" or "is down" doesn't reflect when the slope of a MA turns from up to down. To address that, I have had to compare the current close to a recent highest high. I've worked out that script but I still don't know how to combine that with the other condition. Can anyone suggest a solution?
Hi Brad, sorry I’ve been away and nobody else jumped in. Contact us at [email protected] for specific issues, plus we offer scripting consulting if you need help with complex scripts.
In your example you need to add the slope condition to the close below, so this will highlight when the slope changes and the close is under the 20MA: