Price shocks are one of the greatest opportunities to profit, either by having the price move in your direction, or by capitalising on a possible mean-reverting reaction to the shock. Either way, if you want to be able to scan for price shocks, you need to have a look at the Volatility Ratio. VR is simply the true range of today’s bar divided by the ATR (average of the true ranges of the last n bars).

Remember that the True Range is great because it includes gaps in its calculation. We expect normal days to be within the normal ranges of the ATR. If we get a value of around 3, then that is a signal that there has been some sort of price shock.
Here is the simple script for that VR
TRUERANGE() / ATR()
(not one of our more complex scripts!)To create signals for a ShowBar tool, I split up the script to show upward and downward gaps.
Here is the up script:
TRUERANGE() / ATR() > 3 and close() IsUp
and here is the down script:TRUERANGE() / ATR() > 3 and close() IsDown
Here we can see the gaps on a MSFT chart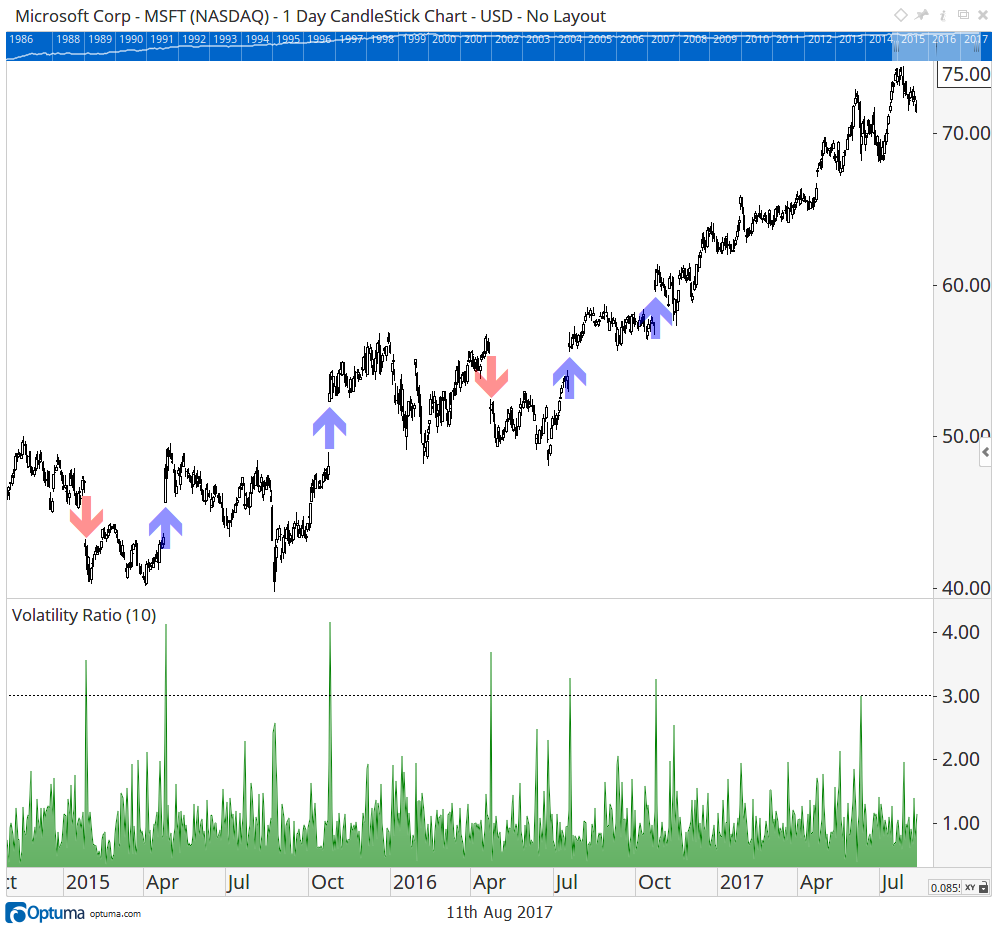
Of course we want to see what happens with a signal like this. This is only for gaps up.

Not so great, but that 10 day trough is interesting to me. What if we delay the signal by 10 days?
Here is that script if you want to try it.
c1 = TRUERANGE() / ATR() > 3 and close() IsUp; TIMESINCESIGNAL(c1) ==10
And here is the signal test:
Now that is more like it! It looks like waiting ten days after a gap is a good idea. There seems to be a mean-reverting reaction and then it takes off after that.
This is a really simple 1 security test and there are not enough signals to make a trading plan out of. I’d also caution that this included the whole history of Microsoft and I did not factor in the effect of the gaps from when it was a penny stock. We really should be testing separate years to see if the returns are consistent.
Based on this, however, it does look like something that is worth exploring a little bit more.
Have fun
Mathew.