MattHat
13 April 2019 07:31
1
Hi All
I would like to set up a scan to scan Volume and Closing price on Daily Charts.
Volume high to be higher than the prevoius day and the day before that, (So 3 days of volume higher than the previous day )
and
The closing price to be higher than the previous day and the day before that.
MYR is a perfect example Apil 5th 8th and 9th
Anyhelp would be great . If i have to i will book a hr with the team to go over it , but if anyone is up to give me some pointers that would be cool
Cheers
vipparla
13 April 2019 09:05
2
please try this ..and just curious how you are using it.
c1 = CLOSE();
//c4
MattHat
13 April 2019 11:01
3
Thanks for that I will try over the weekend .
I guess you would say its a very basic entry , the next day on open .
Then you could use a number of exit plans . Main thing is go in with a plan in place.
Cheers
MattHat
14 April 2019 18:17
4
Thanks for your help SriKanth But i am going to call and get some help from Optuma Tmrw with my scripting. Cheers
DEJHMA8
15 April 2019 05:26
5
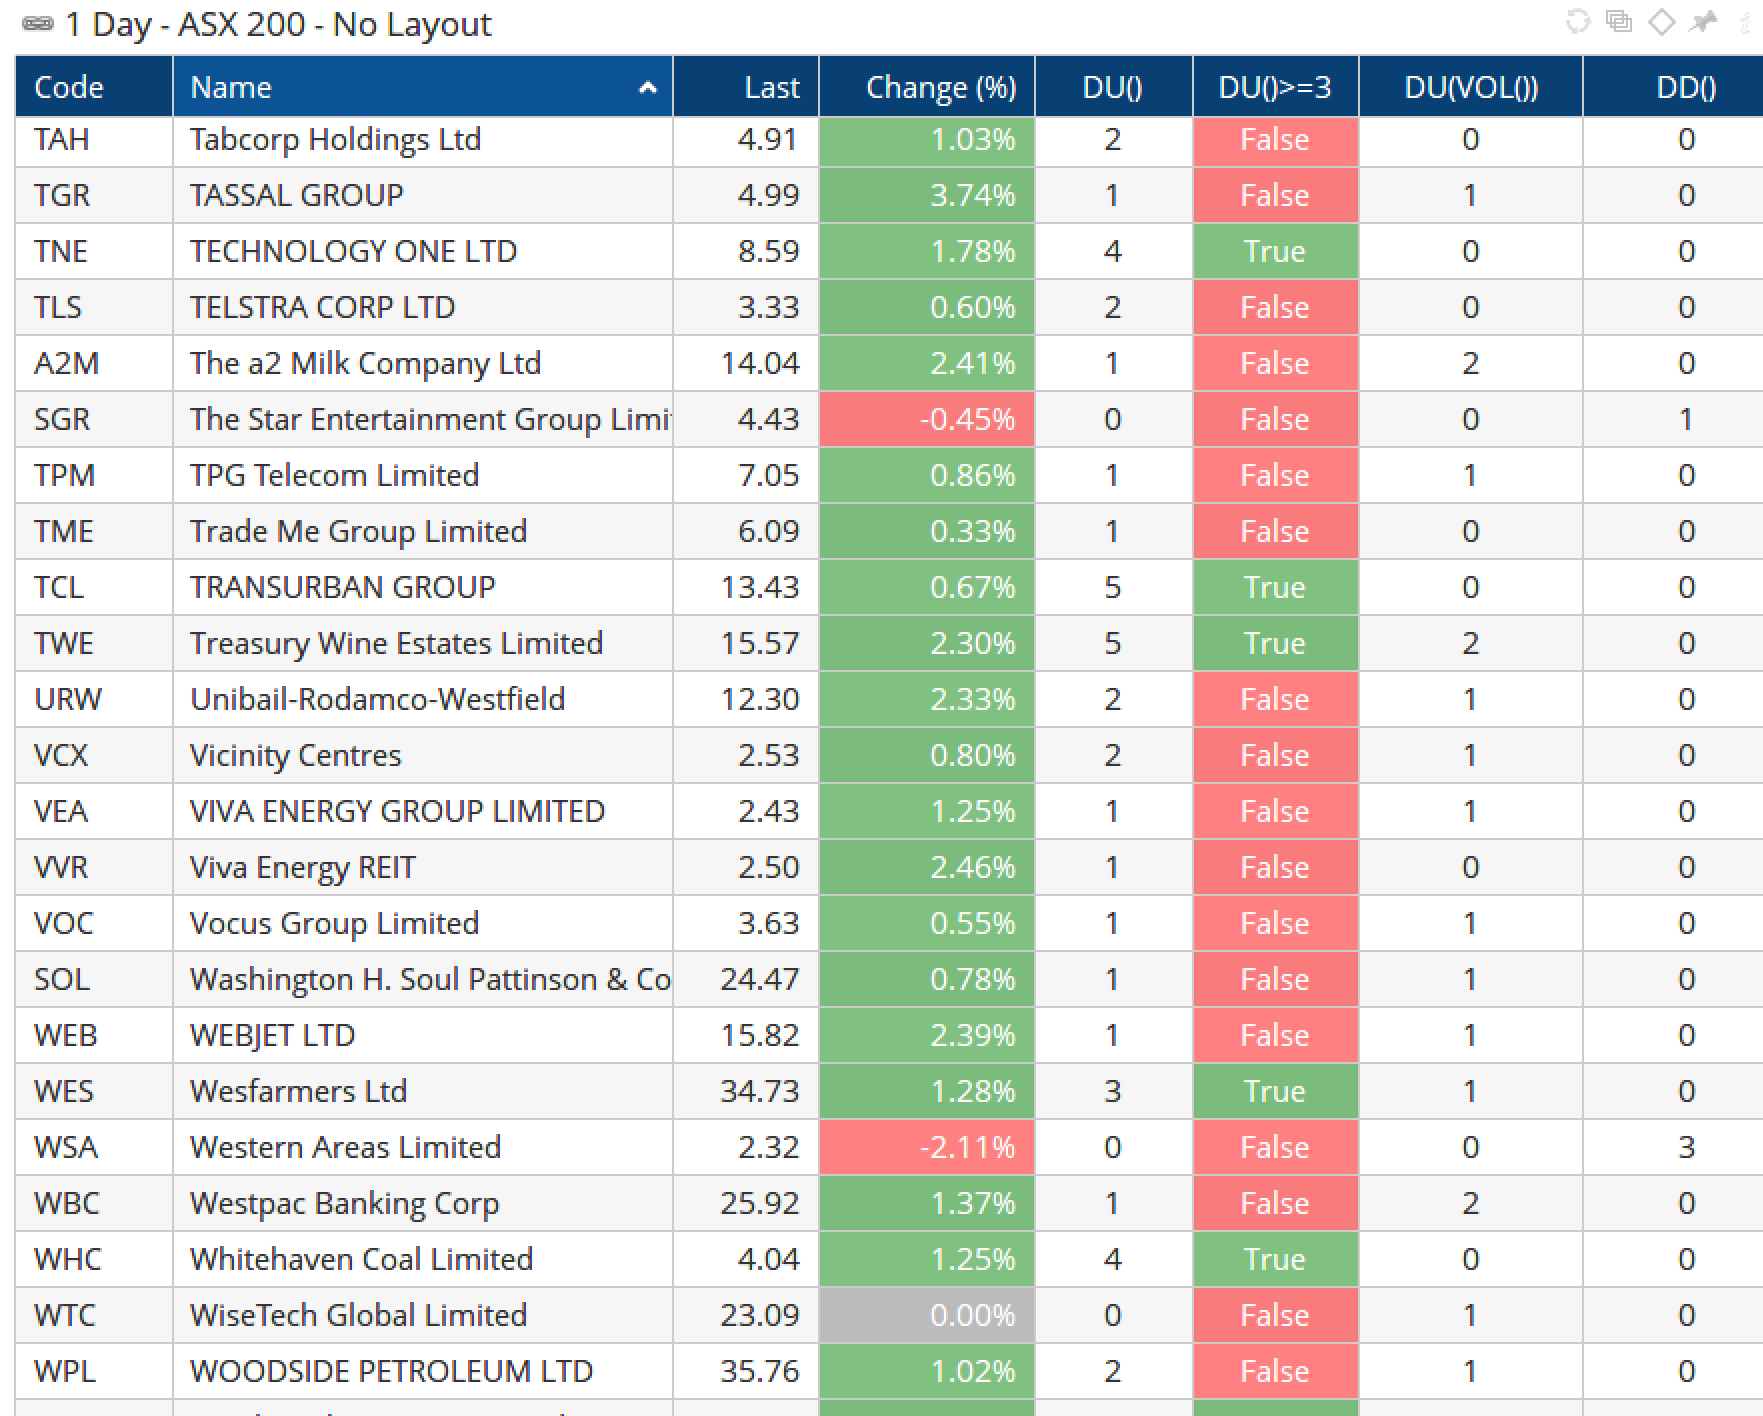
The DaysUp function DU() (and tool) by default counts the number of consecutive higher closing prices, so for other counts (eg volume, RSI, MACD, etc) nest the function within it. More info here:
https://help.optuma.com/kb/faq.php?id=1078
So for consecutive higher volume: DU(VOL()) , as per this example (the opposite is DD() for Days Down):
BARSTRUE()
BARSTRUE(DU(), LOOKBACK=10)
MattHat
17 April 2019 18:09
6
Hi Darren
Mate thanks for your info . I will try it tonight ,
Cheers