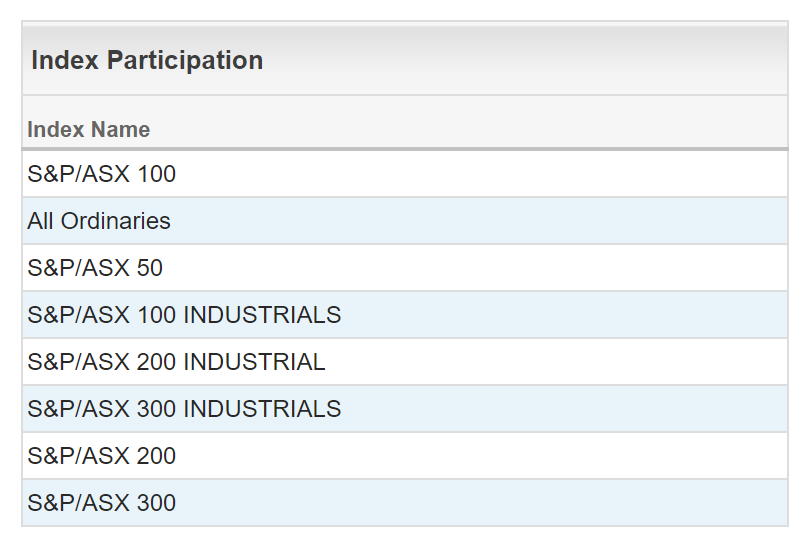
You can use Header Rows to separate codes into sectors. You setup the headers in a way, so that Top 20 are at the bottom, and All Ords are at the top.
You can then expand the sections you are wanting to view to see all the component codes.
Watchlists don’t allow for duplicate codes, so you would need to expand all the sections below the index you wanted to see the codes for. For example, if you wanted to see all the codes in the Top 50, you would expand the Top 20, Top 50 headers. There would be 20 codes under the first header, and 30 under the second.
Another option, if you don’t use the Journal system for other notations, you can add a Note to each of the codes in the Top 200 / Top 300, etc with the information you want to display, then add the Notes column to your Watchlist.
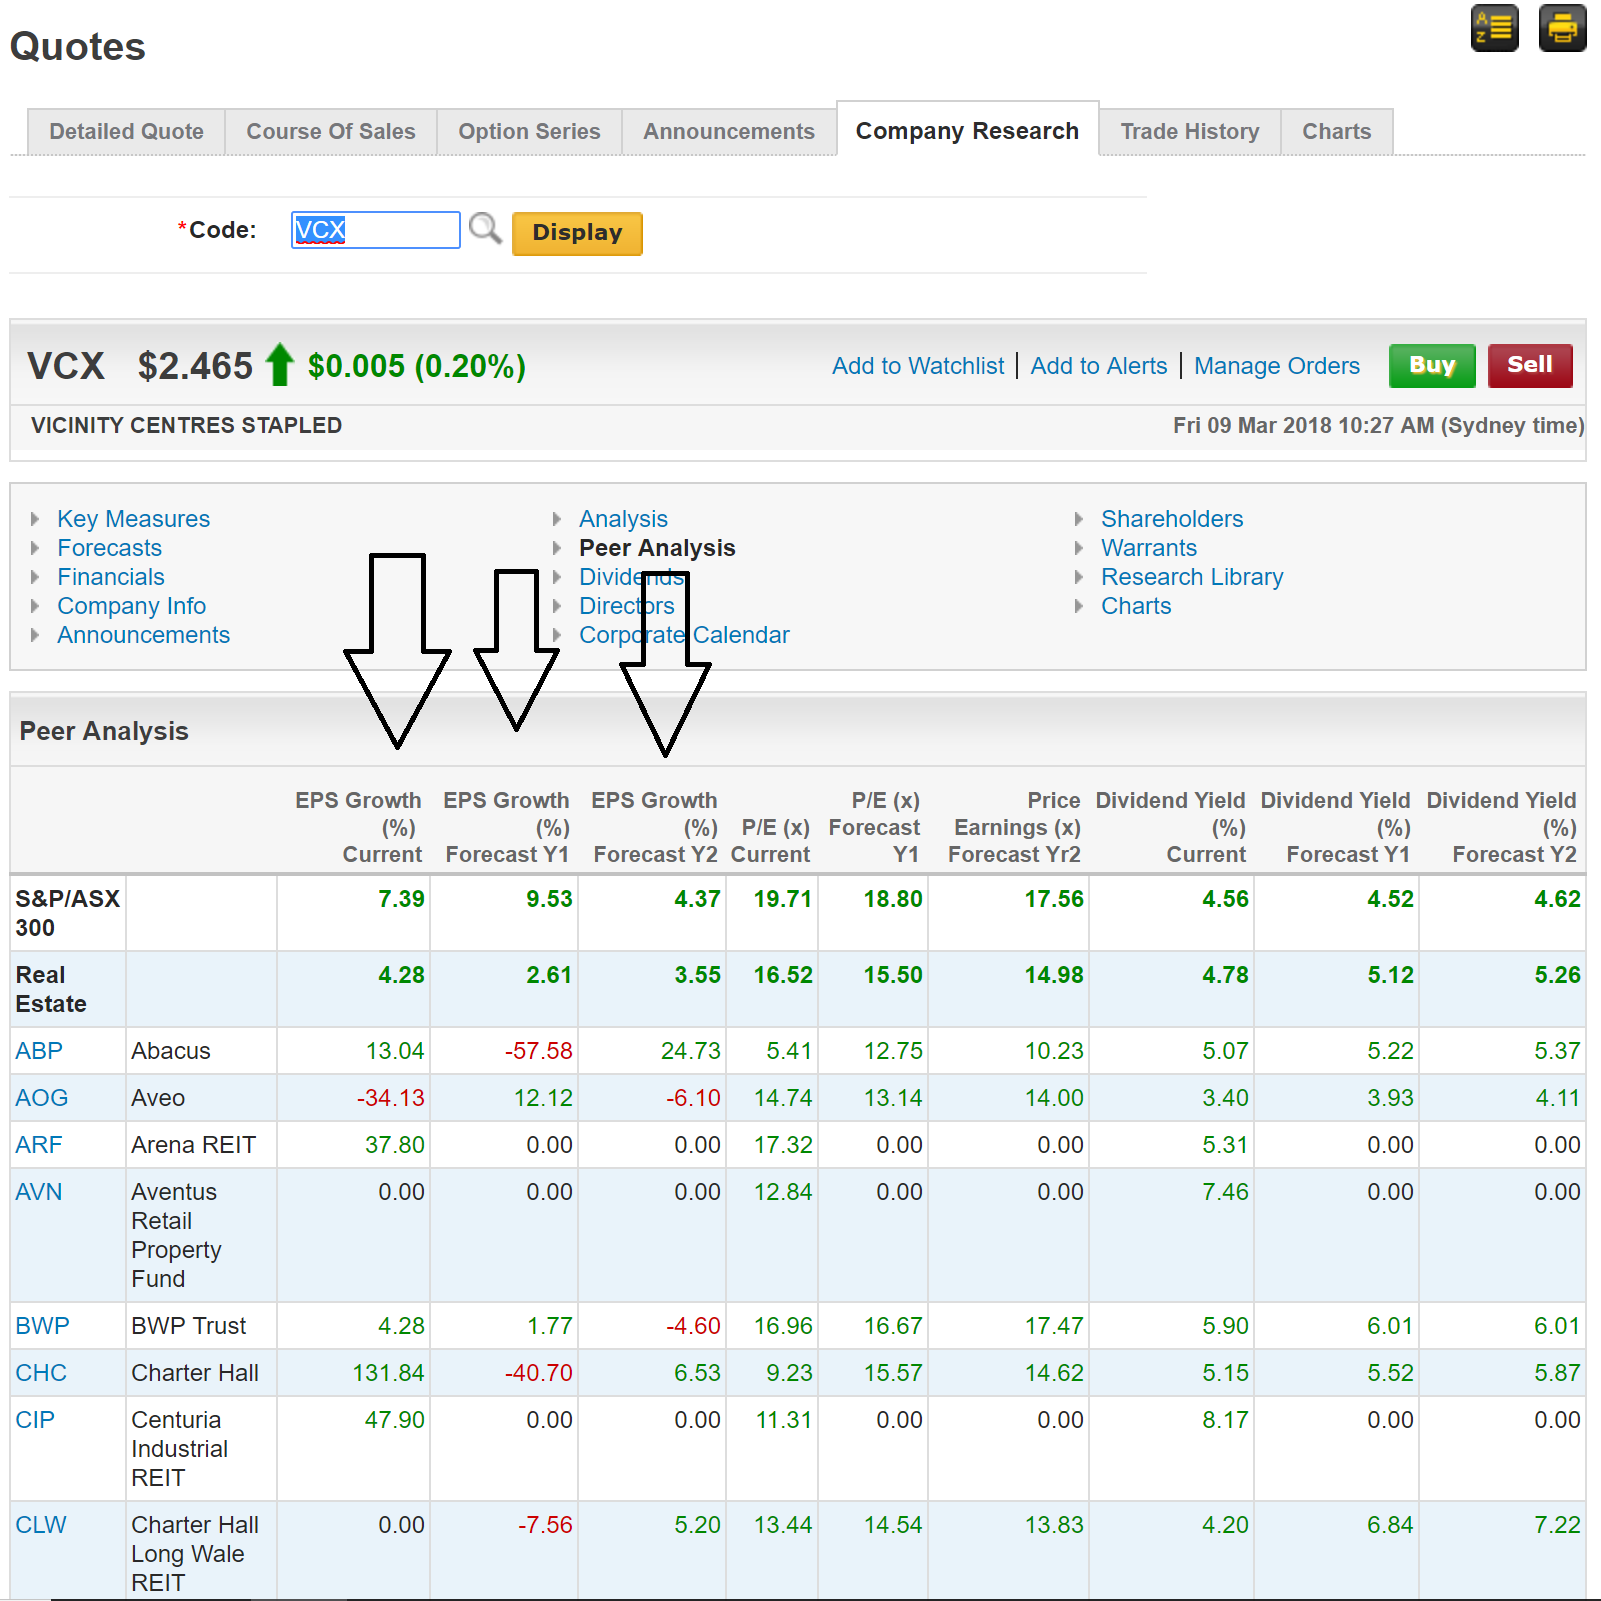
With regards to EPS as a percent, you could script it, as long as you know what the formula being used is in the example you posted (ie is the % based on change over a month, quarter, year, etc?) Once you know that you can build a script wrapping a Change() function around a Datafield() function of the EPS value.