From the top 150 market cap shares on the ASX I wish to measure the percentage rise or fall for each of the past 10 years.
Then using this data, rate these shares on how many years they gain value and by how much. (This should be a reliable selection of shares with a good business models).
Optima’s Watch List may be used to select the top 150 market caps stock. Then it may be possible to script a ‘Seasonality Chart’ set to yearly to do the task of measuring each year’s gains or losses.
Can anyone please tell me if this is feasible and how I should go about it. Or give a me a few clues how to go about this task in other ways.
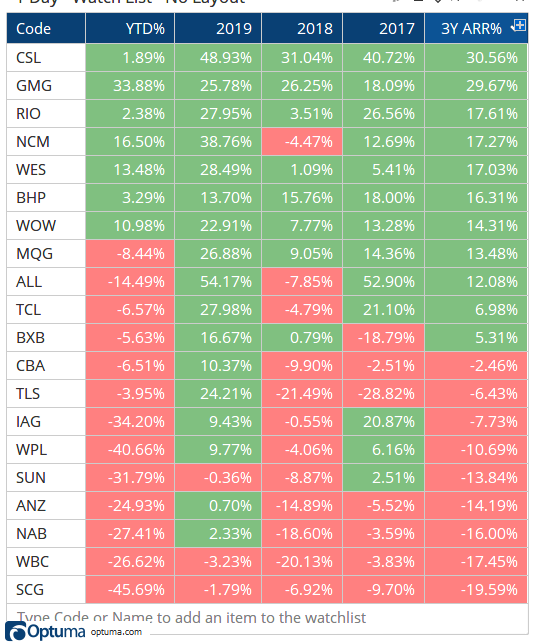
Once in a watchlist column it can be cloned and edited, and change the years in Y1 and Y2. Note that we also have an Annual Rate of Return tool and formula (eg ARR(PERIODAMT=3)/100) which calculates the compounded rate over the last 3 rolling years (ie currently Aug - Aug). So CSL has gained 30.56% per year over the last 3 years to date, and SCG has lost a compounded average of -19.59% per year (mainly this year).