Hi Forum Members,
I need some of your help…
I would like to create a watchlist that automatically updates at when data has been updated in optuma.
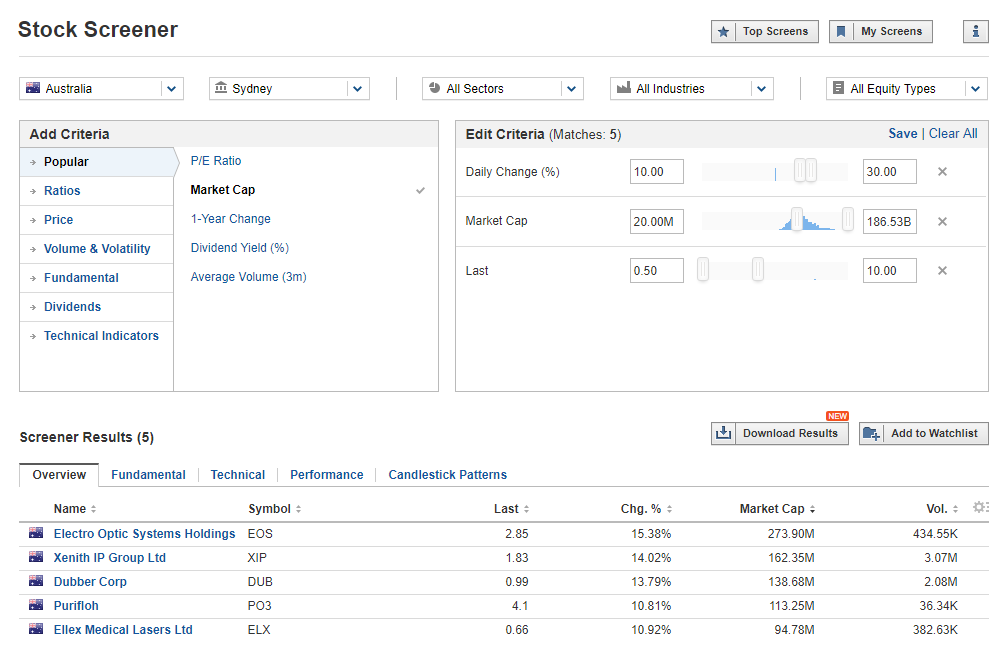
Essentially I am looking to find the biggest gainers of the day, which has a percentage variable, a volume (either % of $) variable.
At the moment I need to use third party providers like investing.com stock screener to perform this which only takes me 10 seconds to do.
Though, for the life of me I cannot get this to work in optuma.
What am I doing wrong?
Hi Jonathan,
The fastest way to do this in Optuma would be to …
- Set up a scan that identifies all codes that have gone up that day. You would use a simple script to do this like CLOSE() > OPEN()
- Export the results to a Watchlist (this will link the WL to the scan so each time it opens it updates automatically).
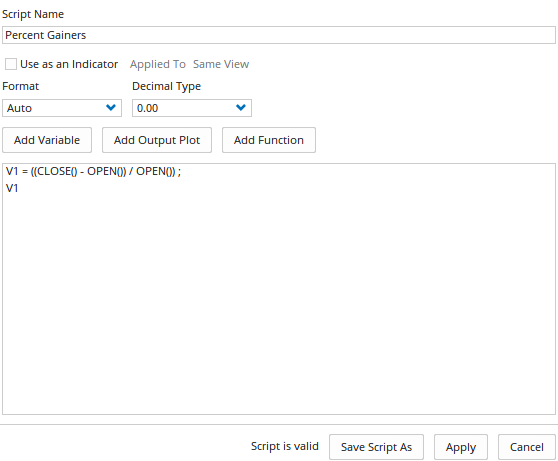
- The Change % column that opens by default in a Watchlist is Close vs previous days close, so remove that and replace it with a custom script column that measures the % gain for the current bar using this:
V1 = ((CLOSE() - OPEN()) / OPEN()) ;
V1
4. Change the columns properties to display as a %
- Sort the codes by the newly added column so the largest % gainers are at the top.
End Result looks like this…

(If you have Enterprise services you can also sort the rows in to Bins and show only those in the highest 10%, 20%, of gains etc.)

Thanks Matthew,
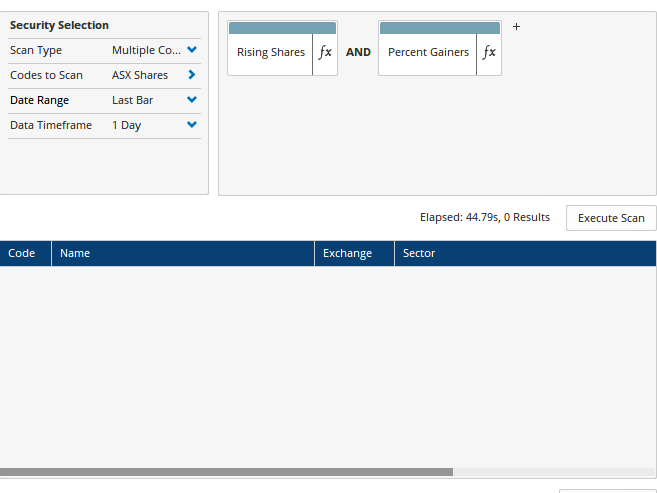
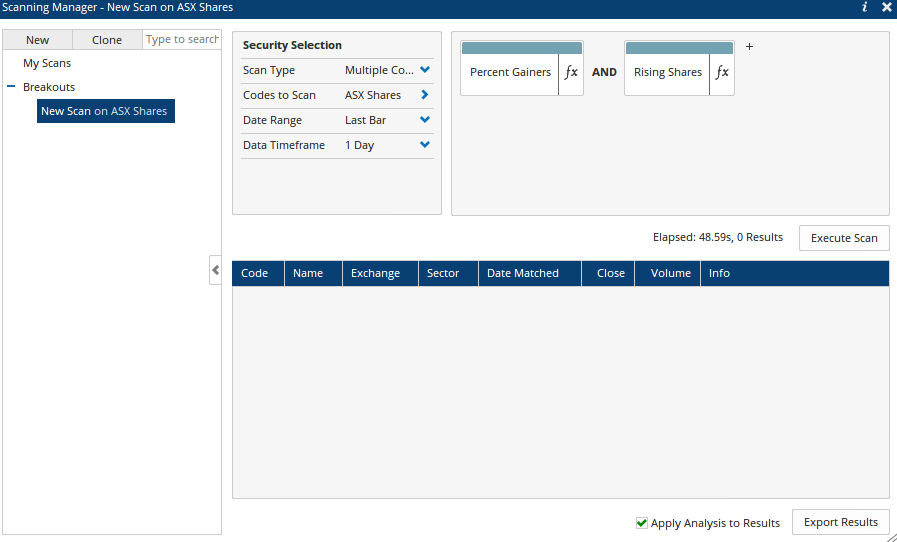
I attempted to replicate the two provided scripts. I then ran the scan on the whole ASX. Though I received 0 results.
IS there a pre-loaded script I can use to only display shares above a certain dollar figure?
Hi Jonathan,
Please provide the formula you are using so we can see the problem, but to filter for stocks above eg $1 simply add and CLOSE()>1. If you have ASX Fundamental data on your subscription you can also filter for eg > $25 million market cap using the DATAFIELD() function with market cap:
DATAFIELD(FEED=FD, FIELD=MarketCapitalization, LATESTONLY=True) > 25
And if you want to filter out illiquid stocks include eg VOLUME()>50000 so are those that traded above 50,000 shares are included.
The Change % field is the daily change (on a daily watchlist, or weekly % on a weekly, etc) so if you run the scan and open as a watchlist, add any other columns you want, and sort by Change % and save the workbook. Then when you next open the workbook the scan will automatically run (because it’s linked to the watchlist) and be updated.
If you need more help we’re happy to arrange a consultation session.

Percent Gainers:
V1 = ((CLOSE() - OPEN()) / OPEN()) ; V1
Rising Shares
CLOSE() > OPEN()
I now want a new variable.
and CLOSE()>1 - 10
(If that is the correct way to script it)
Hi Jonathan,
Only the first script in my reply was meant for the scanning manager:
Close() > Open()
The other script (% Gainers) was to be applied to the Watchlist as a column, not to be used in scanning (scanning needs a True / False script to run that is why no results were returned).
With the new variable you can add that to scripting. If you are wanting the Close to be between $1 and $10 the script would be…
Close() > 1 and Close() < 10