I’m looking for a way to add a column to a watchlist that would show the # of days since a stock’s current Days Up (or Days Down) streak. For example, if the stock is currently up 3 days in a row, and it has been 45 days since it was last up 3 days in a row, the column would show “45”. If the stock rises tomorrow, so it’s up 4 days in a row, then the column would change to “125” (or however long it’s been since it was last up 4 days in a row).
I can do this easily by hardcoding the DU()==3, but then I’d have to change it each day, and it would differ depending on the stocks in the watchlist.
I can’t figure out how to get the TIMESINCESIGNAL formula to reflect today’s value, because it’s kind of circular.
//Set Days Up
V1 = DU() ;
//Find Days Up Last Value
V2 = LAST(DU()) ;
//Find all instances where past DU values are the same as the current value
V3 = V1 == V2;
//Measure bars between each instance
V4 = NONZERO(TIMESINCESIGNAL(V3));
//Add one if you want to include the trigger day
V4 + 1
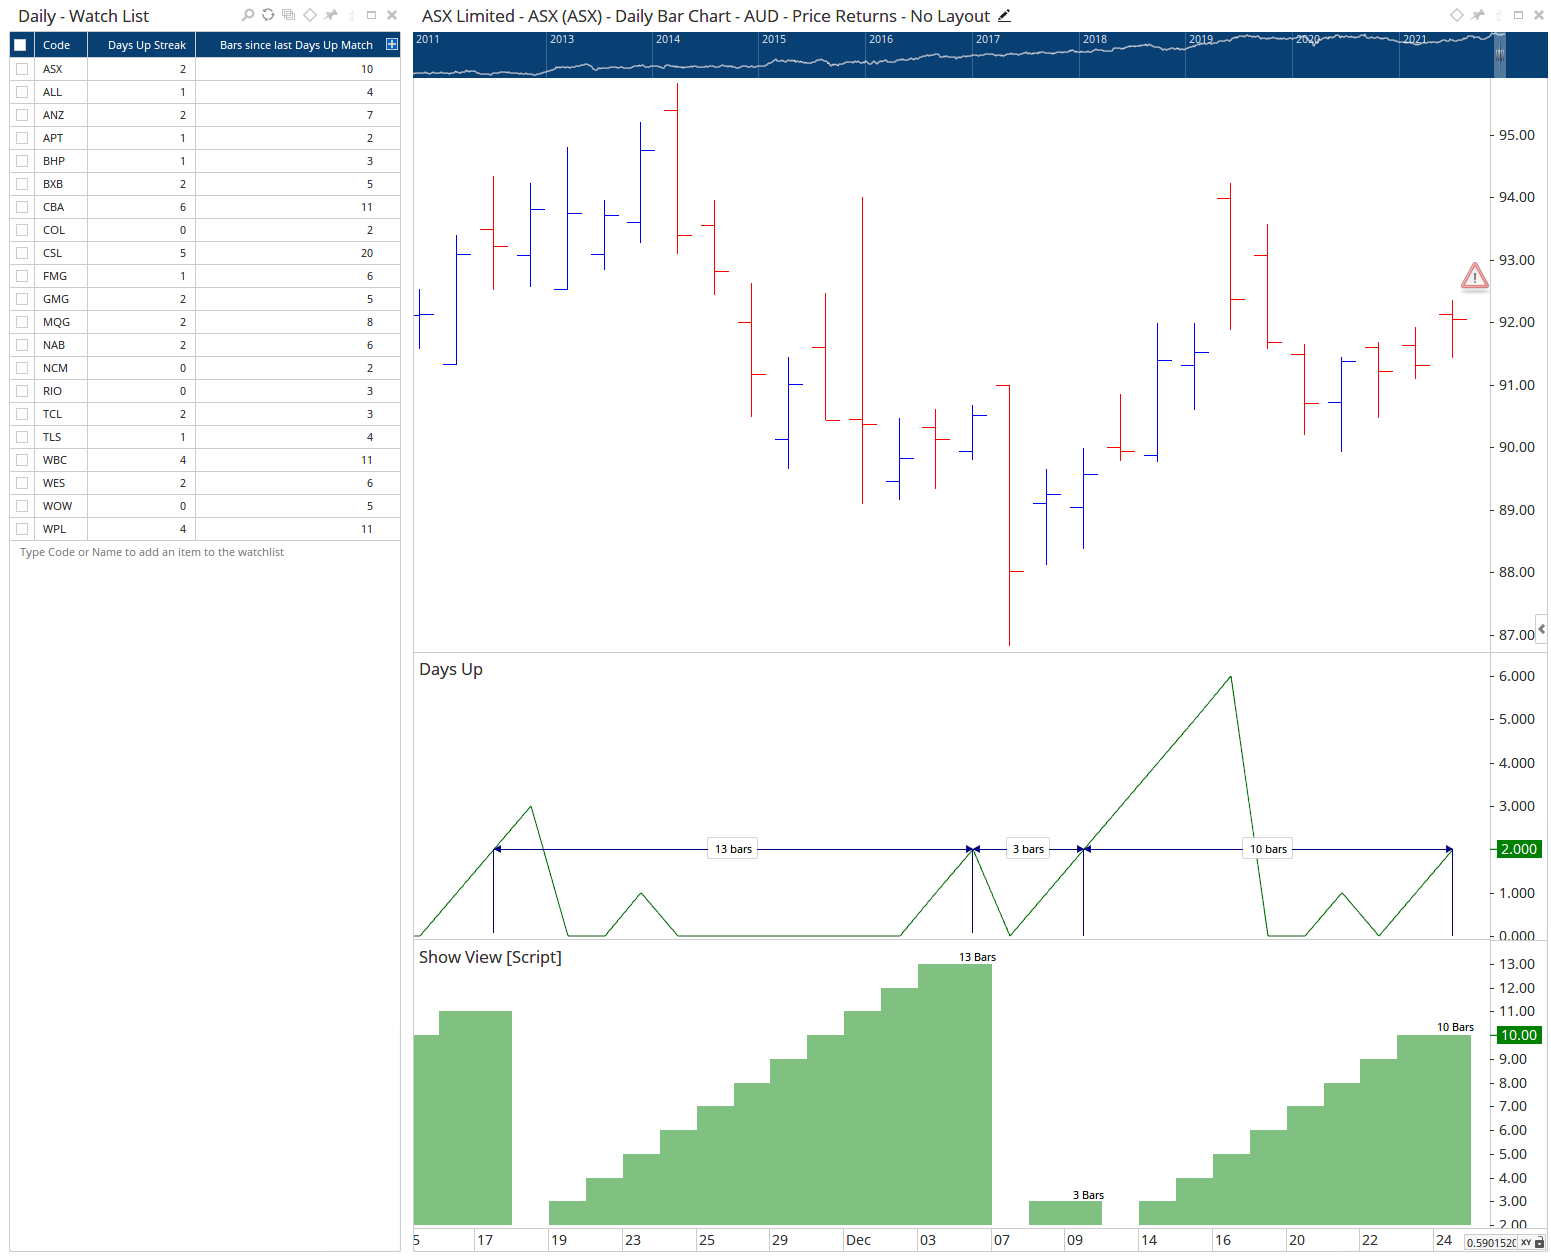
On the chart / watchlist the above script would look like this:
In the above example the current Days Up Streak is two, which last occurred 10 bars ago.
This script is dynamic, it will take the current Days Up streak value, and find when that same value streak last occurred.