I am currently constructing a workbook of the stocks in S&P/ASX 200. The workbook includes a watch list of each of these stocks. I wanted to create a column which shows a potential trade from a reversal in the 3 point swing chart.
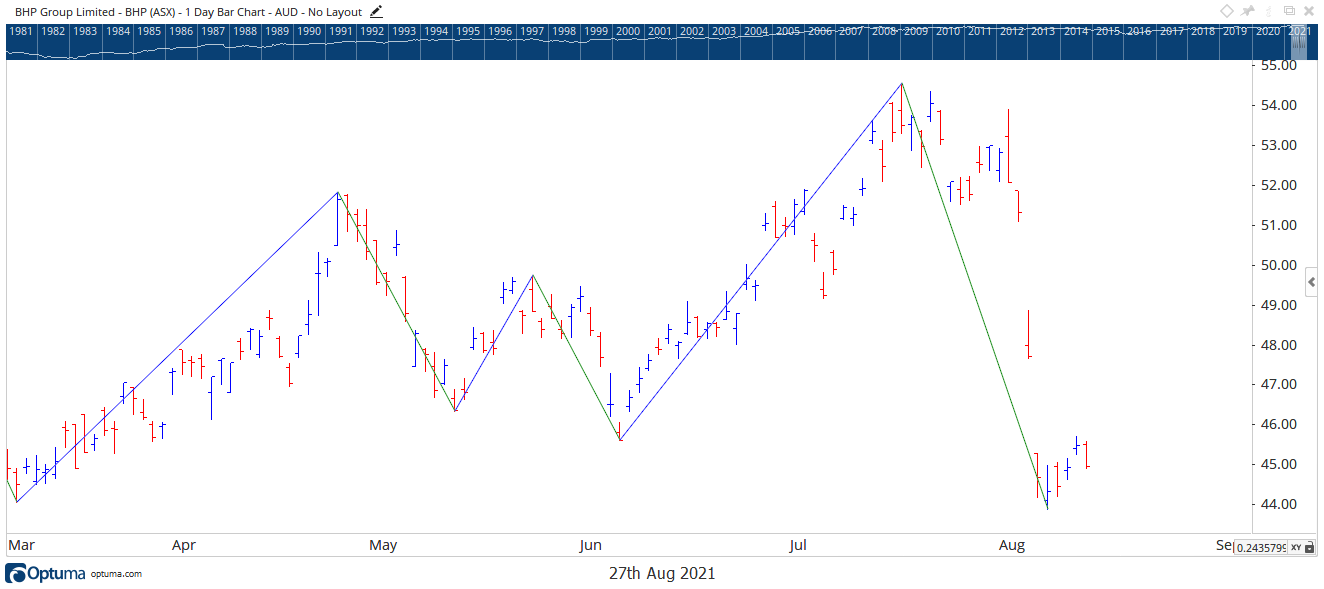
A good example of this would be BHP recently. I have included a chart of BHP with a 3 point swing chart overlay on top of the price data.
On Friday 20 August 2021 the low was 43.88. The idea is to buy on a 3 point reversal. BHP has not traded above 46.88 yet and using this method, that is where a buy order would be placed. Is there any way of including this in a column in a watch list?
Thanks,
Tony