I am currently constructing a workbook of the stocks in the S&P/ASX 200. The workbook includes a watchlist of each of these stocks. I wanted to create a column which shows where a potential double bottom or a double top could potentially arise from where the current stock price is. I was thinking of a script that could detect a potential double bottom or double top within a tolerance of between 1% and 3%.
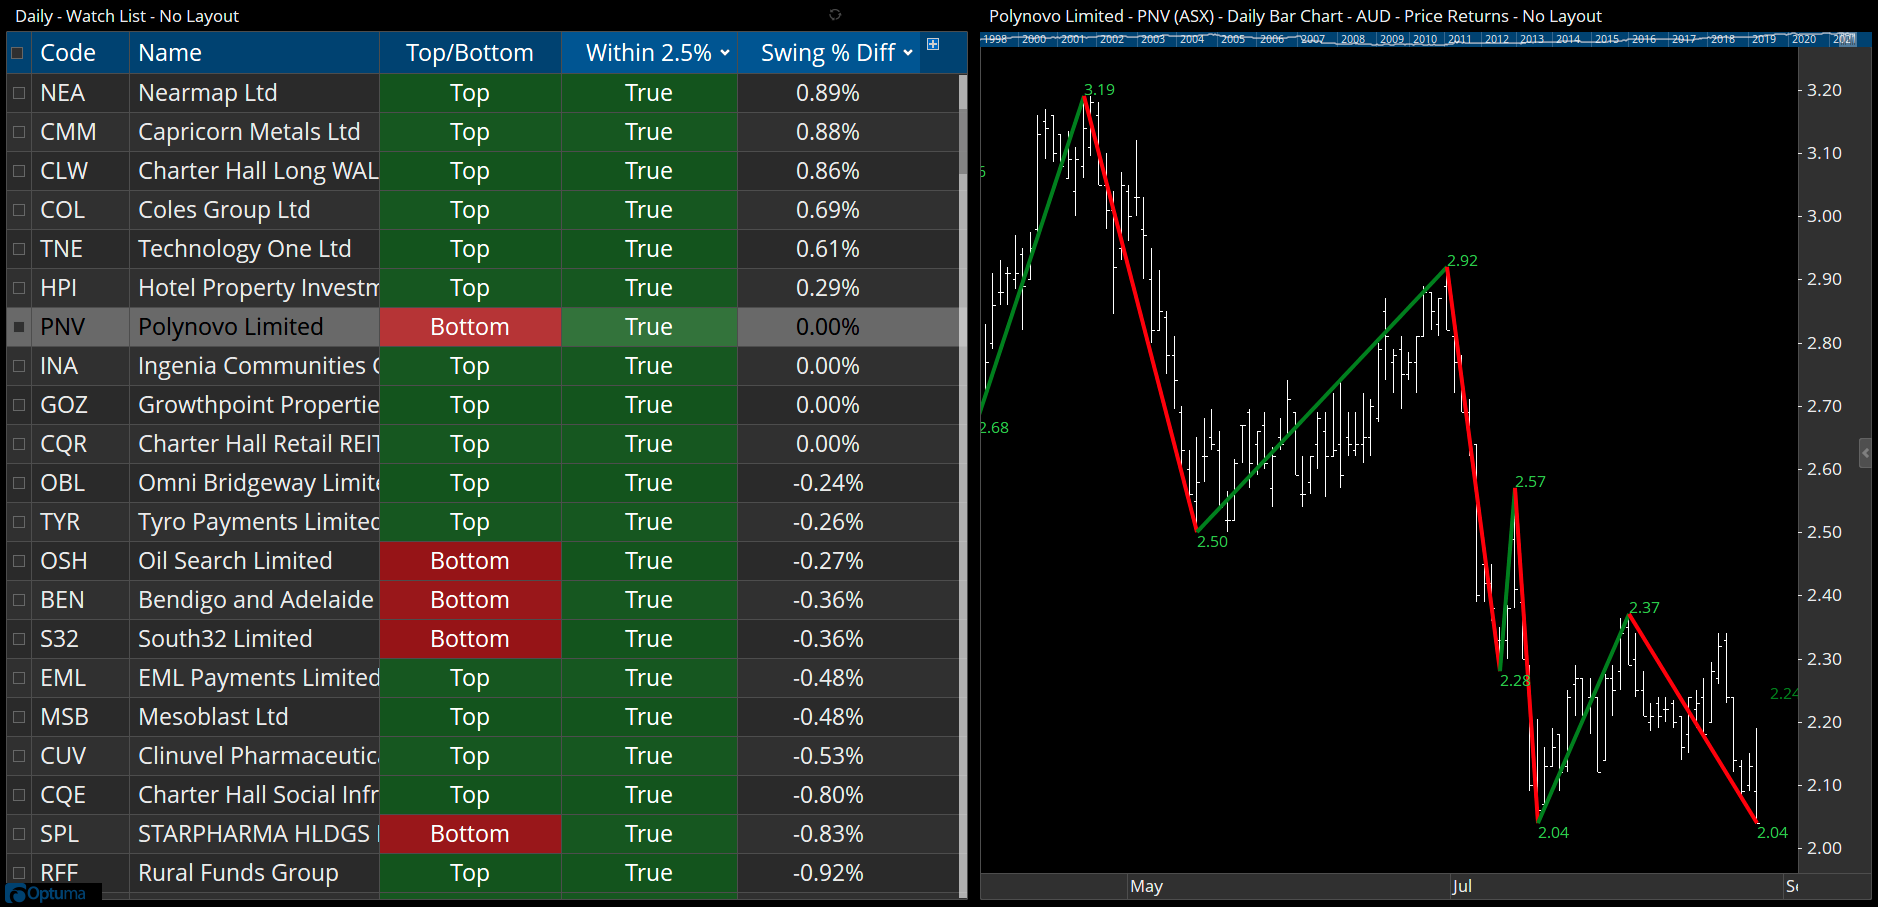
An example of this is Polynovo Ltd (ASX:PNV) which I have attached.
Here’s the script formula I used to create the example. It’s based on 10% swings, but can be adapted for other values or Gann Swings. Workbook for the ASX50 attached.
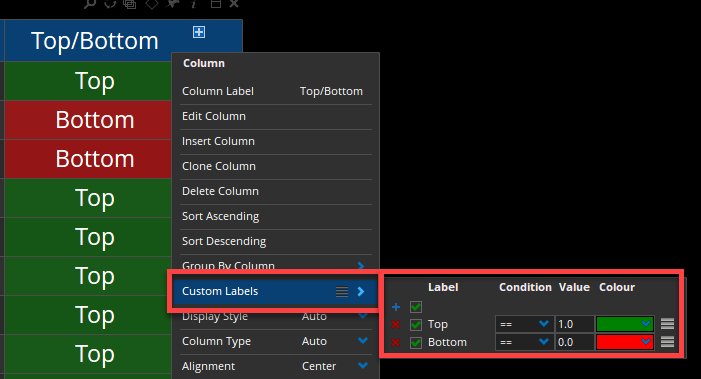
Top/Bottom column for swing direction:
//Set swing parameters;
PS1 = PERCENTSWING(PERCENT=10.0);
//Is the swing currently up?;
SWINGUP(PS1)