I'm wanting to determine where the last close falls within a set of bollinger bands. (ie is it within the lowest 20% of the range - so closer to the lower band than the upper band.)
As a first step, I'm wanting to display the last close in terms of a ratio between 0 (close is on the lower band) to 1 (close is on the upper band). (I think I can deal with closes outside the bands later)
Anyway, here is a script to try to calculate this ratio. It starts with the distance from the close to the lower band, and divides this by the distance from the upper band to the lower band. I'm getting an error message though. Could someone suggest where I need to fix this? Thanks
This returns the position of the Close in relation to the Bollinger Bands High / Low plots as a %. A value of 0% would mean the close is the same value as the BB low plot and a value of 100% would mean the close is the same value as the BB high plot.
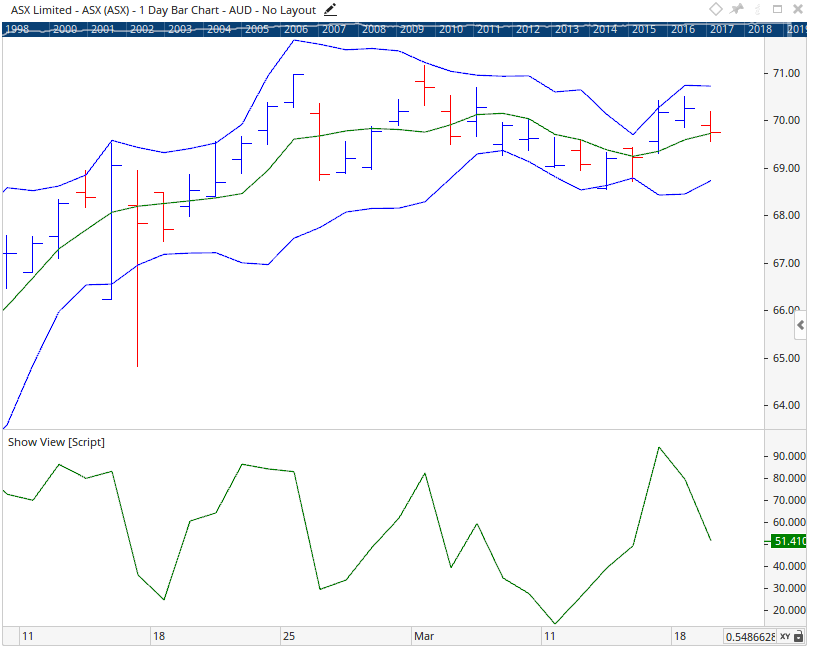
If you look at the bar of March 28, 2018, to the naked eye the close looks to be above 80% of the distance from the lower bollinger band to the upper bollinger band.
And doing the sums:
Upper band = 0.74223
Lower band = 0.72312
Close = 0.7402
Distance from lower to upper band = 0.74223-0.72312 = 0.01911
80% of this distance = 0.8 * 0.01911 = 0.015288
Add 80% of the distance from the lower bollinger band to the lower bollinger band = 0.7402 + 0.015288 = 0.738408
As the close (0.7402) is higher than 80% of the distance from the lower to the upper bollinger band (0.738408), the script should return a result of > 80. As you can see from the horizontal line set at 80, the script returns a result of < 80.
Hoping somebody can see what it is that I'm missing.
You mention the Bollinger bands applied to the chart are using a Calc Style of Geometric, however the script is using a Calc style of Exponential, so there’s a mismatch between the script and the chart.
This may explain the variations you are seeing in the results.
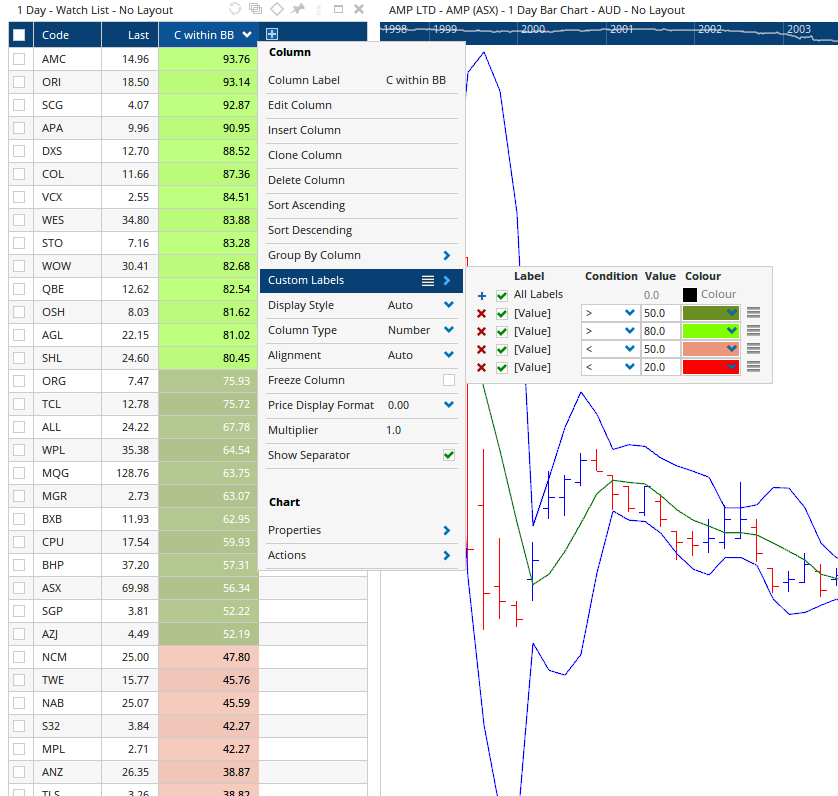
One thing i thought i’d mention is that this script would work well in a Watchlist, combined with rules for colouring. Using these rules you can easily identify codes that are within a specific range (top 20%, bottom 20%, etc).
Below is a screen shot example of what i mean…
For more information on using colour rules in the Watchlist please refer to the following article…