Everything worked as expected, but i still need a little help here, please.
I´m strugling with somethig that i thought will be easy.
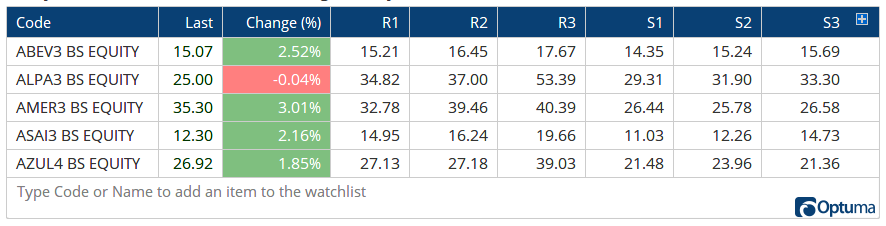
I´m building a watchlist (including scripts above), but also i´d like to show in columms three imediate resistences above the last price and three supports below.
For columm "R2" (second resistence) i used:
V1=PIVOT(MIN=10, TYPE=High);
V2=VALUEWHEN(HIGH(), V1);
v2
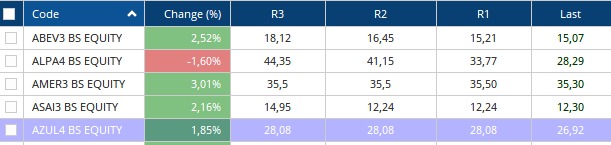
As you can see from the image attached for "ABEV3 BS EQUITY" i think i got it right, but for "AZUL4 BS EQUITY" the values are
exact the same. How is that possible? I´m using diferent mumber on PIVOT MIN.
What am i missing?
Thank you again.
RAFI.
Thanks Rafi. A 6 bar pivot count could be at the same level as a 10 bar count, so you can’t really use that to get the levels.
Getting the previous 6 bar pivot level is quite tricky, but here’s the script - note that I would recommend ignoring unconfirmed pivots in scripting as the labels can change when new data is added to the chart (see the Pivot Label KnowledgeBase article for more information on unconfirmed pivots).
Previous resistance level:
//Define the pivot setting;
Piv1 = PIVOT(MIN=6, TYPE=High, IGNOREUNCONFIRMED=True);
//Get the bar date of the signal before last - increase the OFFSET to go further back;
P1 = BARDATE();
P2 = LAST(BARDATE(NONZERO(Piv1), OFFSET=1));
Signal = P1 == P2;
//High value at the signal;
VALUEWHEN(HIGH(),Signal)
Increase the OFFSET value in P2 to get the value of the previous pivot labels. The support levels use the same script but modified slightly to use the Low pivot type in Piv1, and to get the Low value. Save and open the attached workbook in your copy of Optuma.