Yearly return script for current year

I use this script to examine watch-list for individual securities or index yearly return, take 2018 for example

M1 = YEARNUM() == 2018;
M2 = YEARNUM() == 2017;
V1 = VALUEWHEN(M1);
V2 = VALUEWHEN(M2);
((V1/V2)-1)

This script works very well for any selected year except the ongoing year, in this case, the year 2019.

Where could go wrong in this script or what should i edit in order to make it functional here?

Thanks and have a good day ~

Hi Yan,

A really easy way to do this is to use Yearly data, then we are simply comparing the closes from one bar to another.

So on a daily chart, I can add this one line script

CHANGE(Year(PERIODAMOUNT=1), INT_TYPE=Bars, INT_COUNT=1)

The part in bold changes the data to Yearly bars before calculating the change function.

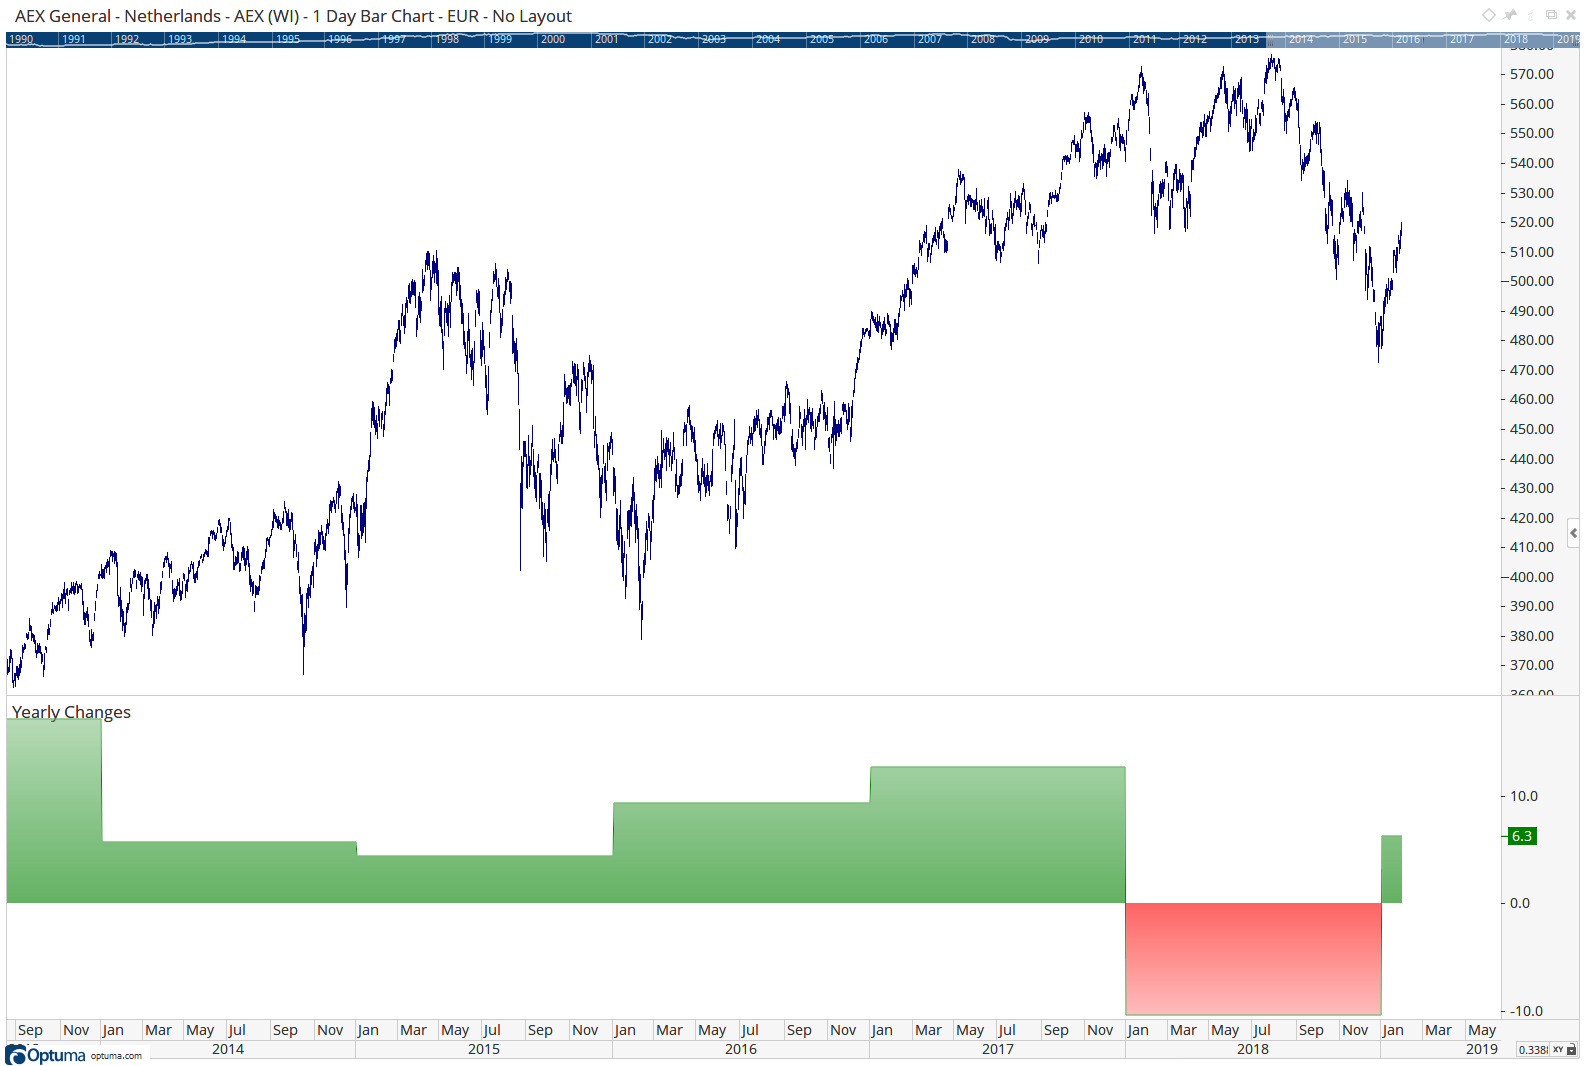
Here is the result of that.

Yearly

Note that each value is the final value for the year. 2019 is correctly showing a gain of 6.3% (in the Dutch Market at least) which is the year to date.

Hope that helps

Mathew

Hi Mathew,

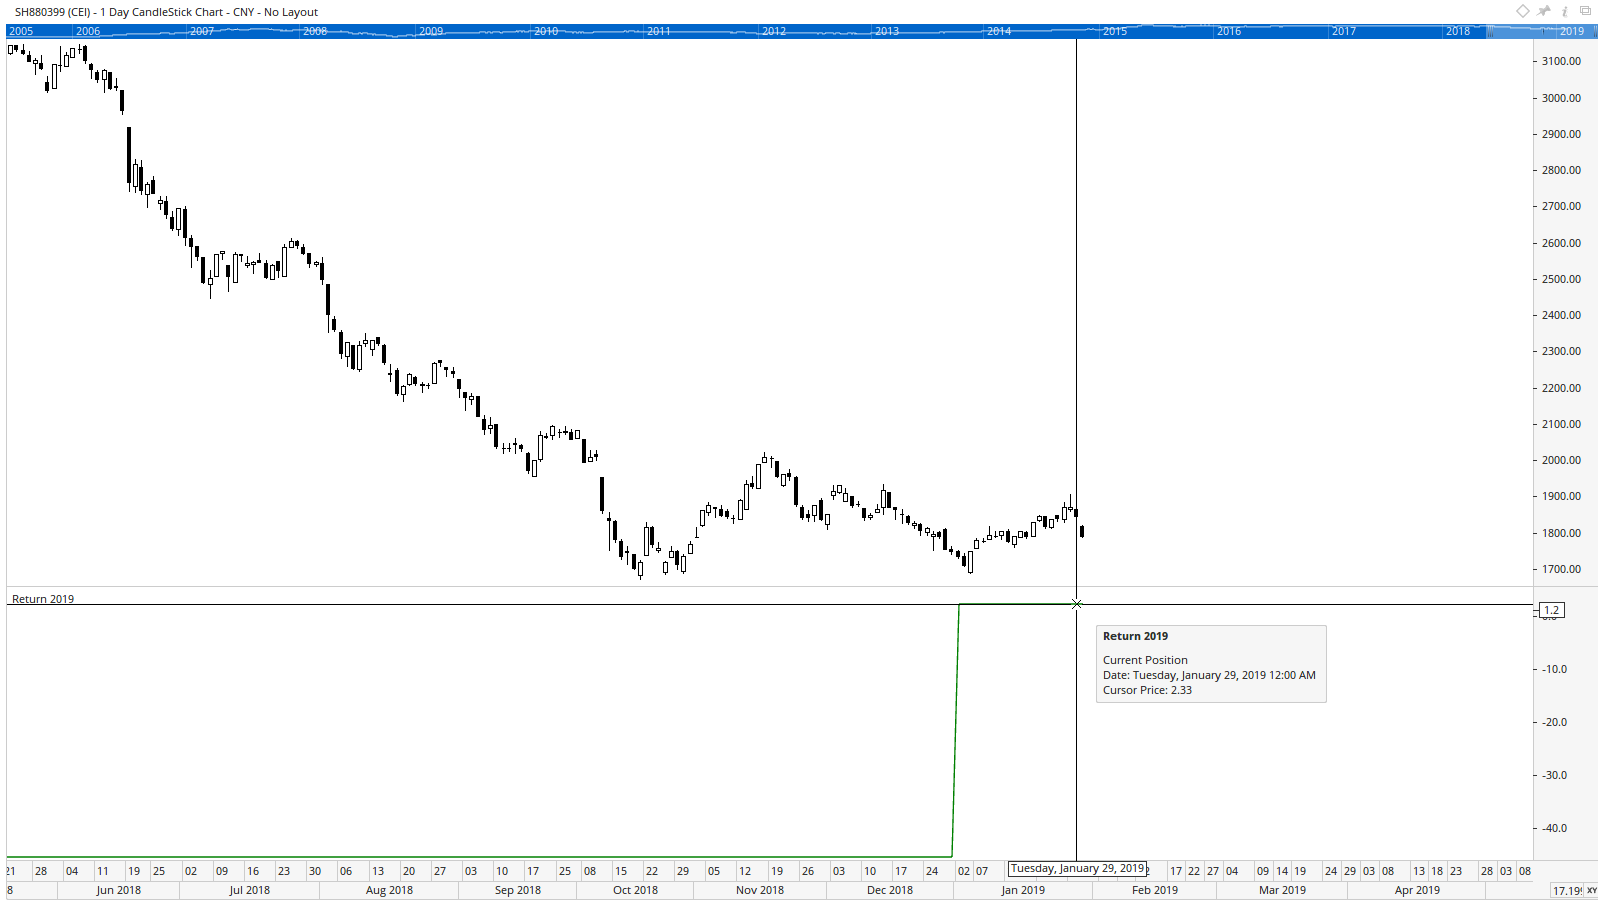
The script works well on daily chart, but when i apply it on the watch list, this script doesn't work anymore. Notice that all the data shown for the year 2019 are identical compared to the 2018's.

So something must be wrong here. Can you check this out ?

Thanks

731

732

Hi Yan,

Your Watchlist properties aren’t in view, however if your Date Range settings are set to Last Year, try adjusting it to Everything.

i followed your instruction and i found the problem. Yes, it was the un-updated date range cause this problem. Problem solved..

Thanks and have a good day.