A request to add StochRSI. Developed by Tushar Chande and Stanley Kroll eons ago, this classic indicator is pretty standard indicator for technical analysis platforms. I created it as a script, but it would be better to have as an indicator to change the timeframe without affecting every chart with the script. The signal lines would be set at .20 and .80. Thanks for considering!
Thanks Art. What script are you using? If the timeframe isn’t specified in the formula then it will be calculated for the timeframe of the chart / watchlist it has been applied to.
Hey Darren. Actually, I meant the number of periods used to calculate the indicator (default is 14).
Thanks Art. I found this script which will use 14 periods, whatever the chart timeframe:
R1 = RSI(BARS=14);
LLR1 = LOWESTLOW(R1, BARS=14, INCBAR=True);
HHR1 = HIGHESTHIGH(R1, BARS=14, INCBAR=True);

StochRSI = (R1 - LLR1) / (HHR1 - LLR1);

Plot1=StochRSI;
Plot2=0.8;
Plot2.Colour = Black;
Plot3=0.2;
Plot3.Colour = Black;

Good day, thank you for the script for a StcochRSI indicator on OPTUMA. I did attempt to use this however, it lacks the smoothK and smoothD indications. I’m having to use 2 charts, OPTUMA and my broker chart to see my trade signals. As you may appreciate this is not ideal. OPTUMA is a great product but is only as good as its tools and indicators.
Please can we have the proper StochRSI indicator added to OPTUMA? It’s a standard tool on all broker platforms and I cannot understand why it isn’t included with OPTUMA. Please, please.
Thank you
Steve
With regards to my previous post I have managed to get the source code for a StochRSI on trading view which appears to be the original by Tushar Chande and Stanley Kroll. I don’t have the programming expertise to translate this to OPTUMA. Would it be possible for someone to assist me with this?
//Developed by Tushar Chande and Stanley Kroll.
//Robert C. Miner calls it by his proprietary name, Dynamic Trader Oscillator or DTOsc and his considerable
// innovations were to set the oversold level at 25, set the overbought level at 75,
// and to come up with 4 special settings: 8,5,3,3 13,8,5,5 21,13,8,8 34,21,13,13
// His High Probability Trading Strategies is one of the best books ever written on trading.
study(title=“StochRSI”, shorttitle=“StochRSI”)
source = close
lengthRSI = input(8, minval=8), lengthStoch = input(5, minval=5)
smoothK = input(3,minval=3), smoothD = input(3,minval=3)
OverSold = input(25), OverBought = input(75)
rsi1 = rsi(source, lengthRSI)
k = sma(stoch(rsi1, rsi1, rsi1, lengthStoch), smoothK)
d = sma(k, smoothD)
hline(OverSold,color=blue)
hline(OverBought,color=blue)
plot(k, color=black,title=“k-line”)
plot(d, color=fuchsia,title=“d-line”,linewidth=1)
Many thanks
Steve
To add to my last post, maybe I’m better at programming than I thought. I seem to have reproduced the StochRSI 14,14,3,3 output I want (very slight difference) with the following:
R1 = RSI(BARS=14);
K1 = MA(STOCH(R1,R1,R1,14),3);
K1 = MA(STOCH(R1,R1,R1,BAR1=14),BARS=3);
D1 = MA(K1,3);
Plot1=K1;
Plot1.Colour=green;
Plot2=D1;
Plot2.Colour=red;
Plot3=80;
Plot3.Colour = Red;
Plot4=20;
Plot4.Colour = Red;
There may be some errors in here since I don’t fully understand the STOCH function but it seems to work. If someone could check it for me I would very much appreciate it.
Thank you
Steve
Hi Steve,
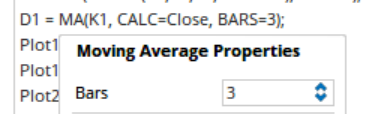
It’s close, but you need to click on the text in the script editor to change the criteria to get the correct syntax, which may explain the slight difference. For example, D1=MA(K1,3) will not calculate a 3 period MA of K1 - you need to select 3 from the popup so that Bars=3 is added to the text:
R1 = RSI(BARS=14);
K1 = MA(STOCH(R1,BAR1=14),BARS=3);
D1 = MA(K1, CALC=Close, BARS=3);
Plot1=K1;
Plot1.Colour=green;
Plot2=D1;
Plot2.Colour=red;
Plot3=80;
Plot3.Colour = Red;
Plot4=20;
Plot4.Colour = Red;
Once you get the logic we’ve tried to make it as easy as possible to learn scripting for non-programmers. To watch short tutorial scripting videos to get started click on the Help menu in the software and then Scripting Resources > Scripting Courses.
Let us know how you go.
Will do, much appreciated. Thank you.
Hi Steve,
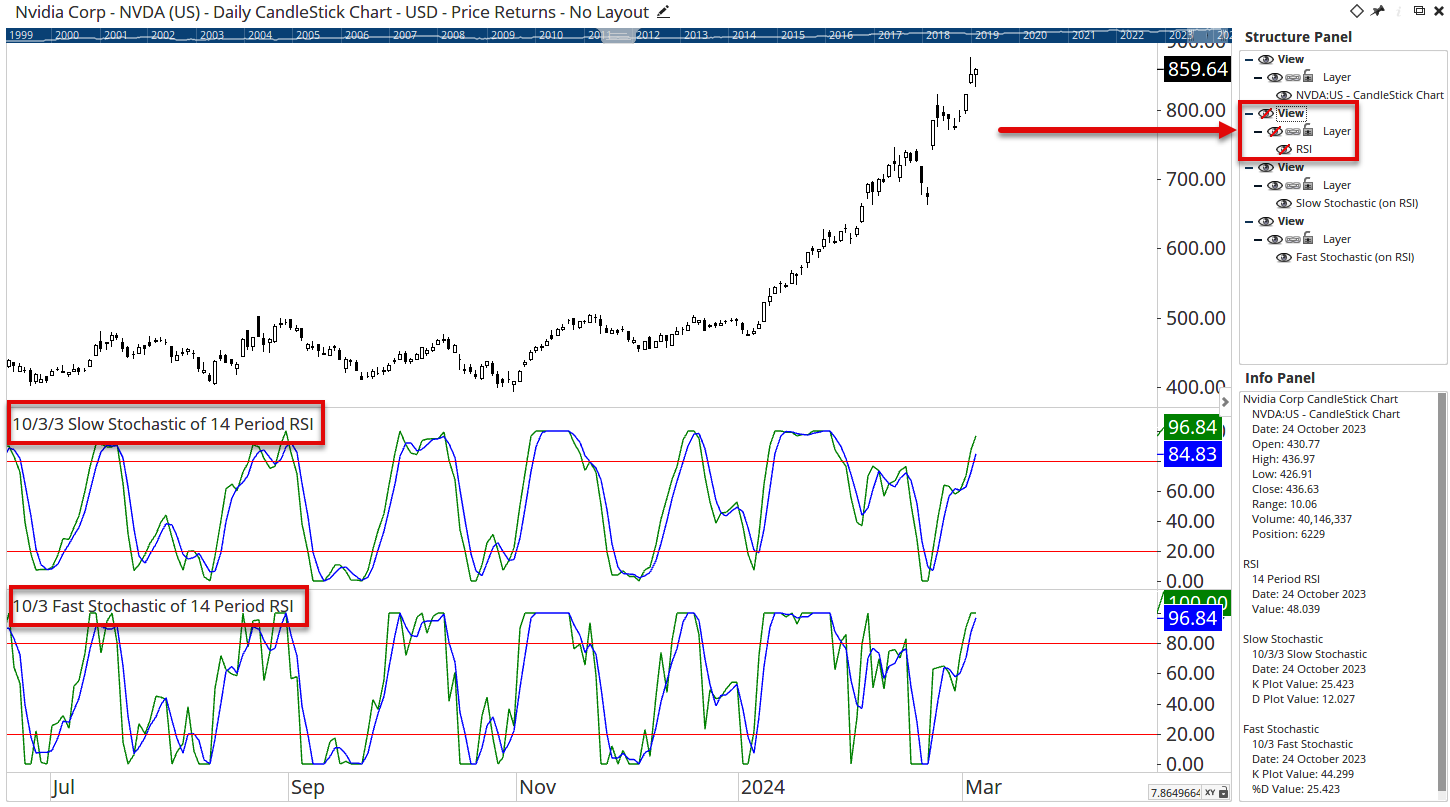
As an alternative to scripting, remember that you can add an indicator to an indicator. Right-click in the RSI panel and select the Slow or Fast Stochastic from the right-click Tool menu, and the stochastcic will then be calculated on the RSI. See this video on how to apply an indicator to an indicator.
You can then hide the RSI from view via the Structure Panel so only the StochasticRSI is visible (note the label in the indicator panel states that the stochastic is of the RSI):
That’s great, thank you Darren.
Steve