I have tried all of the following scripts in an Analysis Cluster to identify the start and end of a Volatility Swing.
//Current Volatility Swing IsUp
SWINGEND(VOLATILITYSWINGS()) IsUp
VOLATILITYSWINGS(DEFAULT=SwingEnd) IsUp
VOLATILITYSWINGS() IsUp
SWINGUP(VOLATILITYSWINGS())
The first one gives the closest desired result but in reverse.
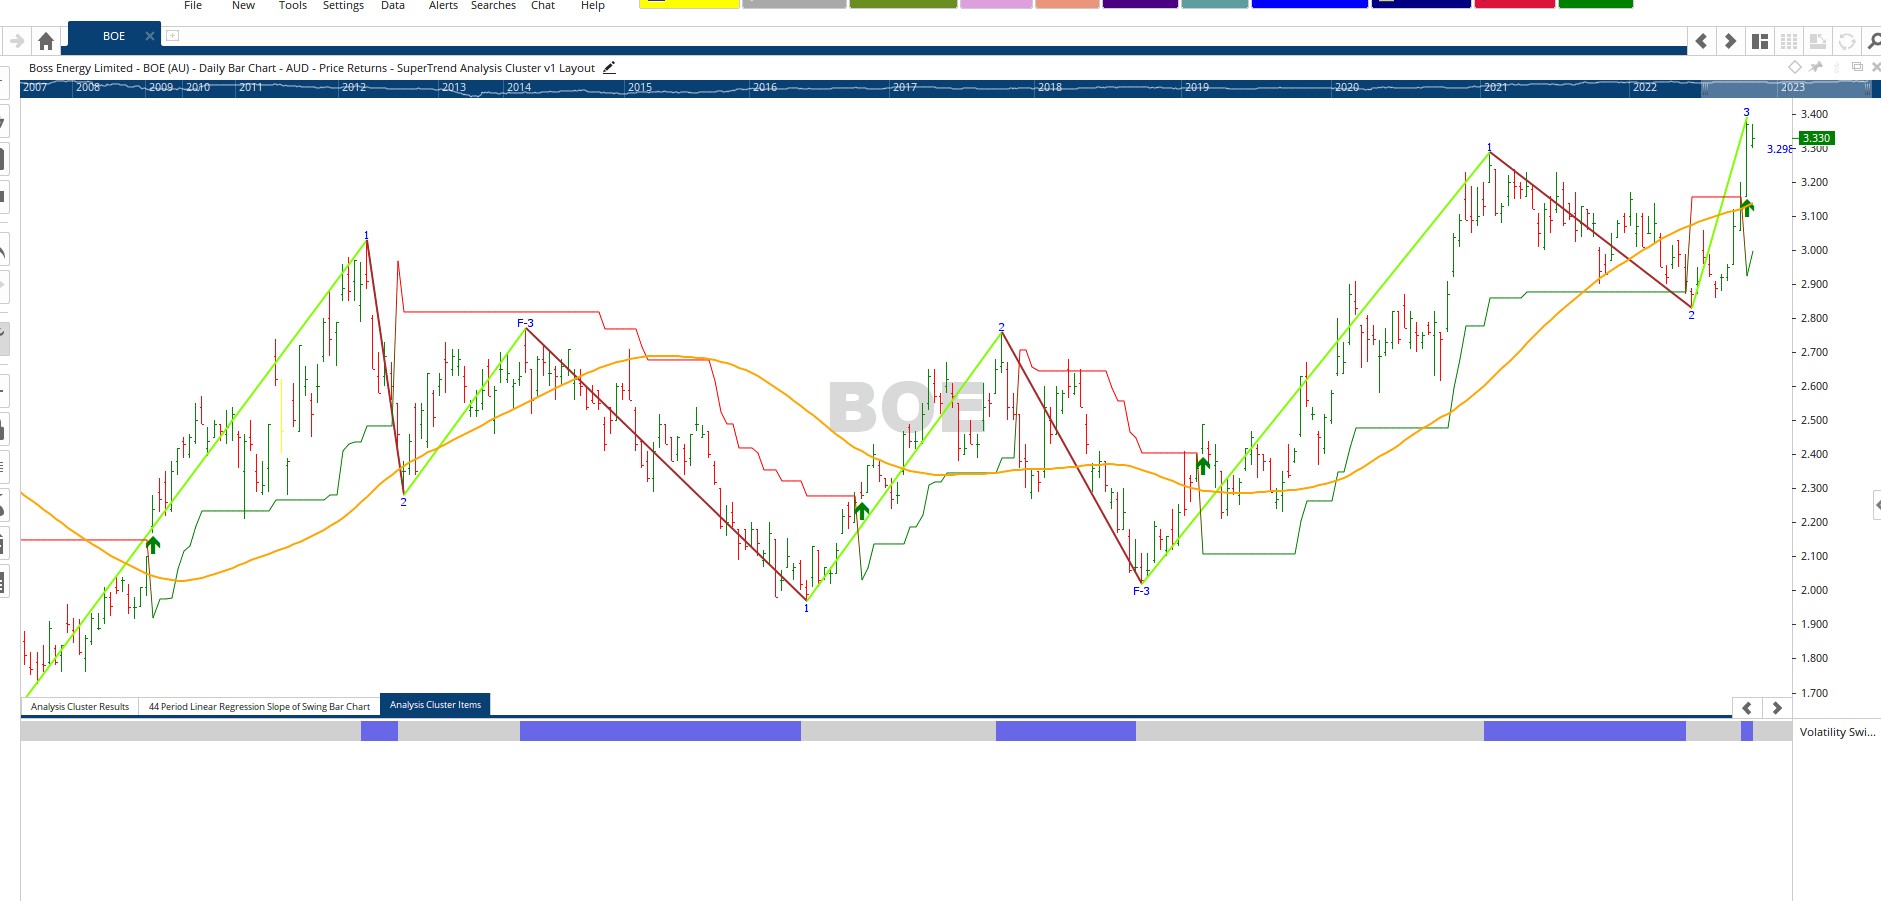
In the attached screen shot I’m looking for F3-1 to be highlighted in the cluster, 1-2 not highlighted and the current 2-3 to be highlighted.
Also in the older Optuma videos the first script is used but I have noticed in the Script Manager the second script other options are available but I can’t find any information about these settings and how they should be used (Swing List, Bar Labels, Label Status, Label Ratio, Swing End, Swing Start) noting these are not in the Volatility Swing tool settings.
Do you just want to know when the swing is up? Remember that one of the issues with all swings is that the turns are not confirmed until several bars after a potential high or low (change the colour scheme to Unconfirmed or use the Training Mode with the overlay to see when the turns are made).
Use the following on a Show Bar and you will see when high bar has confirmed the ATR move off the low:
VOLATILITYSWINGS() TurnsUp
In this example, the low at 1 was not confirmed until 2.37 which happened 10 days later (similarly TurnsDown confirms the high at 2 when 2.30 was reached, and the unconfirmed swing overlay colour changes from black to red at that level in price - not time).
If you use SWINGUP(VOLATILITYSWINGS()) then it will show when the swing is up once it has been confirmed, but not from the low or high because at the time we wouldn’t have known that was the turn. Hope that makes sense!
As for the script outputs, you can add them as watchlist columns to see the values (we’ll get a KB article added to the scripting section).
Thanks for the reply, every interesting regarding the different volatility swing script outputs, couple of questions;
What are the Swing List and Bar Label outputs denote
Is there any importance in the Label Ratio being above or below 1.00 (ie 100%).
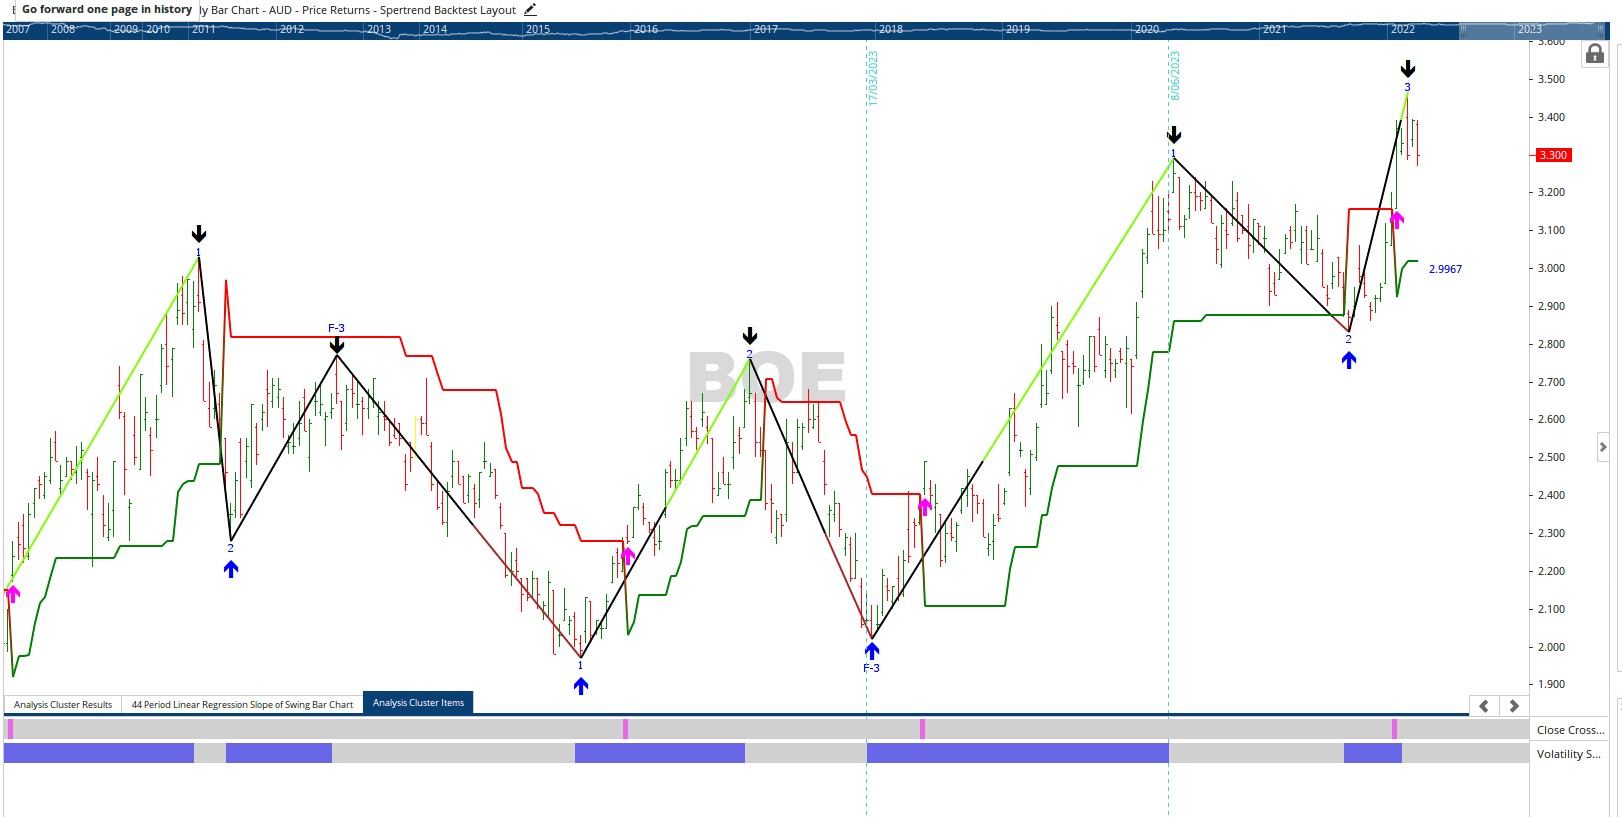
Regarding my original question I have been playing around with different options and the scripts below seems to place a show bar without confirmation of the swing (the black when the "swing" turns down and blue for "swings" up). See attached screen shot. They work but I not sure if I should be using them given the swing has yet to be confirmed.
//Volatility Swing Turns Down
S1 = VOLATILITYSWINGS(ATRBARS=10);
SWINGEND(S1) and SWINGUP(S1)
//VOLATILITYSWINGS() TurnsUp
S1 = VOLATILITYSWINGS(ATRBARS=10);

SWINGEND(S1) and SWINGDOWN(S1)
BarLabel is the current swing count, ie 4 in the ORG example. SwingList is the latest swing value (the same as the last SwingEnd value). As for the ratio, it’s useful if you look at retracements eg 0.38 or 1.38 for Fibonacci levels, but not so important if not.
It’s best to wait for swing confirmation as you would never know those were the lows at the time (ie the pink arrows show when the upswing is confirmed).