I’m trying to plot the 6mth high and low on Bollinger Bandwidth using the following script.
//Calculate Bollinger Band Width
BollingerBandwidth=BBW(BARS=20);
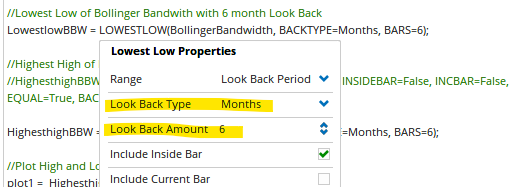
//Lowest Low of Bollinger Bandwith with 6 month Look Back
LowestlowBBW = LOWESTLOW(BollingerBandwidth, Month(PERIODAMOUNT=1), BARS=6, INSIDEBAR=False, INCBAR=False, EQUAL=True);
//Highest High of Bollinger Bandwidth with 6 month Look Back
HighesthighBBW = HIGHESTHIGH(BollingerBandwidth, Month(PERIODAMOUNT=1), BARS=6, INSIDEBAR=False, INCBAR=False, EQUAL=True);
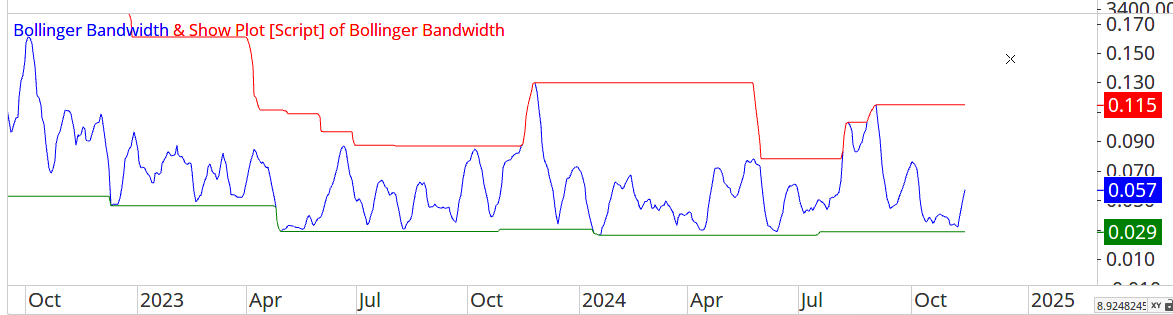
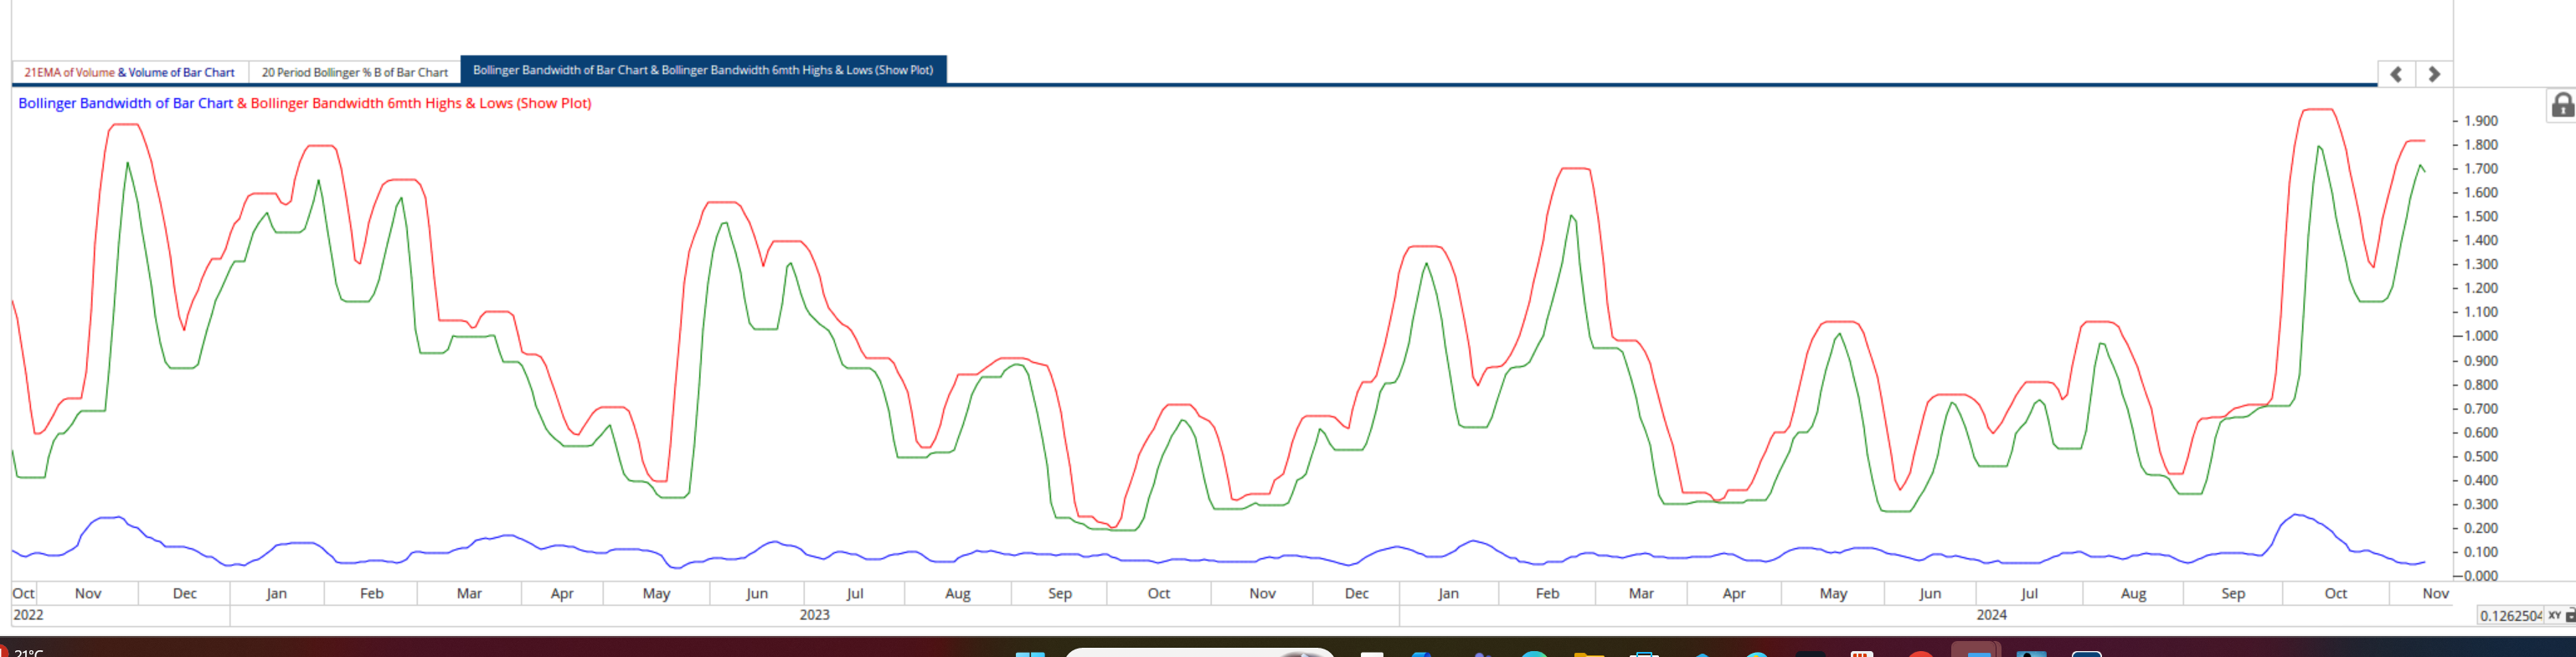
//Plot High and Low BBW
plot1 = HighesthighBBW;
plot1.Colour = Red;
plot2 = LowestlowBBW;
plot2.Colour = Green;
Thanks
Tim