Has anyone replicated the Chameleon trend indicator and Chameleon oscillator?
Thanks, Jamie
Has anyone replicated the Chameleon trend indicator and Chameleon oscillator?
Thanks, Jamie
Hi Jamie,
Do you know what the parameters are? This is what I’ve found in an old workbook, based on 4 criteria which can be displayed in a Show View:
V1 = MACD(BAR1=12, BAR2=26, OSC=9, DEFAULT=Oscillator) > 0;
V2 = MA(BARS=50, CALC=Open) > MA(BARS=50, CALC=Close);
V3 = ROC(BARS=25) > 0;
V4 = CLOSE() > MA(BARS=50, CALC=Close);

V5 = (V1 + V2 + V3 + V4);

V5
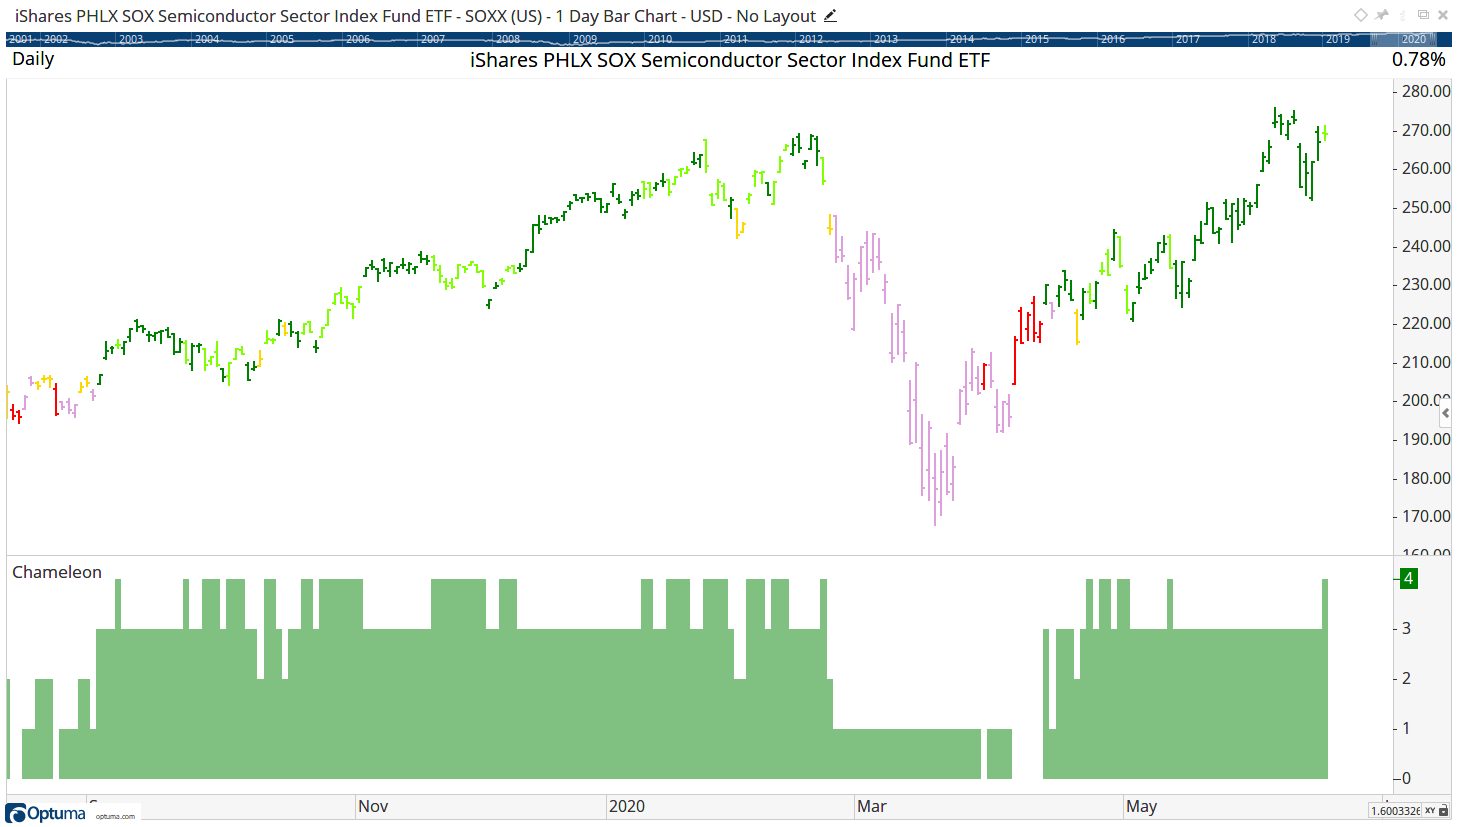
The bar colours correspond to the values, ie red when the value is 0 and bright green for 4. A copy of the workbook can be downloaded below.
Chameleon.owb (13.4 KB)
I believe those are correct for the trend indicator. The Chameleon Oscillator is based on this:
The Chameleon Oscillator is a blend of several indicators and changes colors based on a combination of the indicators’ readings. The Oscillator calculates how many overbought/oversold criteria are being met for three momentum indicators: Bollinger Bands, RSI and Stochastics. The indicator value varies from -6 to 6. It turns bright red when the most overbought conditions are recorded and bright green when most conditions are oversold, with varying shades in between. Specific indicators are:
Bollinger Bands - price relative to one and two standard deviations from the 20-period mean.
RSI - using a traditional 14-period and a faster 9-period lookback and 70/30 overbought/oversold levels.
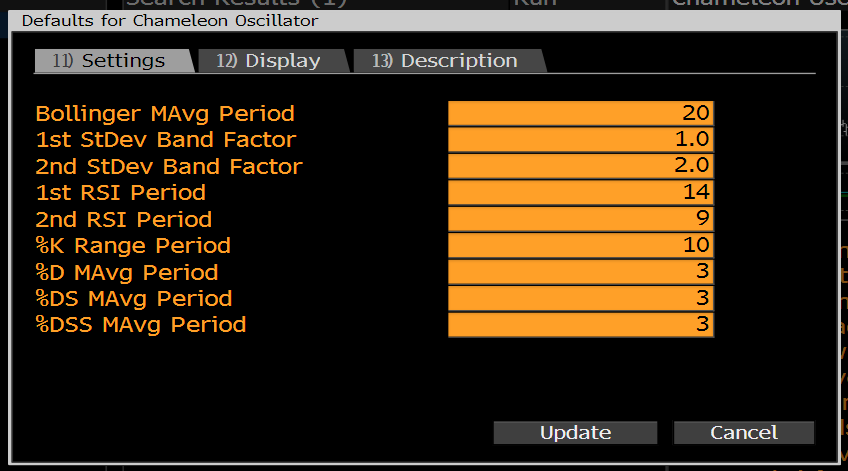
Stochastics - including both the %D and %DS lines and 80/20 overbought/oversold levels. The default parameters values can be adjusted.
see attached for parameters.
Thanks, appreciate your help
OK thanks, but we’d need to know the formulas and the respective values to be able to calculate +/-6 ranking system, eg is RSI(14)>70 valued at +1 and RSI(9)<30 at -1, etc?
Here is what I came up with?
V1 = CLOSE() > BB(BARS=20, DEFAULT=UpperLine, STDDEV=1.000000);
V2 = CLOSE() < BB(BARS=20, DEFAULT=LowerLine, STDDEV=1.000000);
V3 = CLOSE() > BB(BARS=20, STDDEV=2.000000, DEFAULT=UpperLine);
V4 = CLOSE() < BB(BARS=20, STDDEV=2.000000, DEFAULT=LowerLine);
V5 = RSI(BARS=14) > 70;
V6 = RSI(BARS=14) < 30;
V7 = RSI(BARS=9) > 70;
V8 = RSI(BARS=9) < 30;
V9 = STOCH(TYPE=Fast, BAR1=10, BAR2=3) > 80;
V10 = STOCH(TYPE=Fast, BAR1=10, BAR2=3) < 20;
V11 = STOCH(TYPE=Slow, BAR1=10, BAR2=3, BAR3=3) > 80;
V12 = STOCH(TYPE=Slow, BAR1=10, BAR2=3, BAR3=3) < 20;
V13 = V1 + V3 + V5 + V7 + V9 + V11;
V14 = (V2 + V4 + V6 + V8 + V10 + V12) * -1;
V13 + V14
I wish i had a chart off Bloomberg to compare results?
Thanks Jamie. I don’t have access to that Bloomberg study to compare, but the formula looks good if put in a Show View.