Hi, here is my Feature Request:
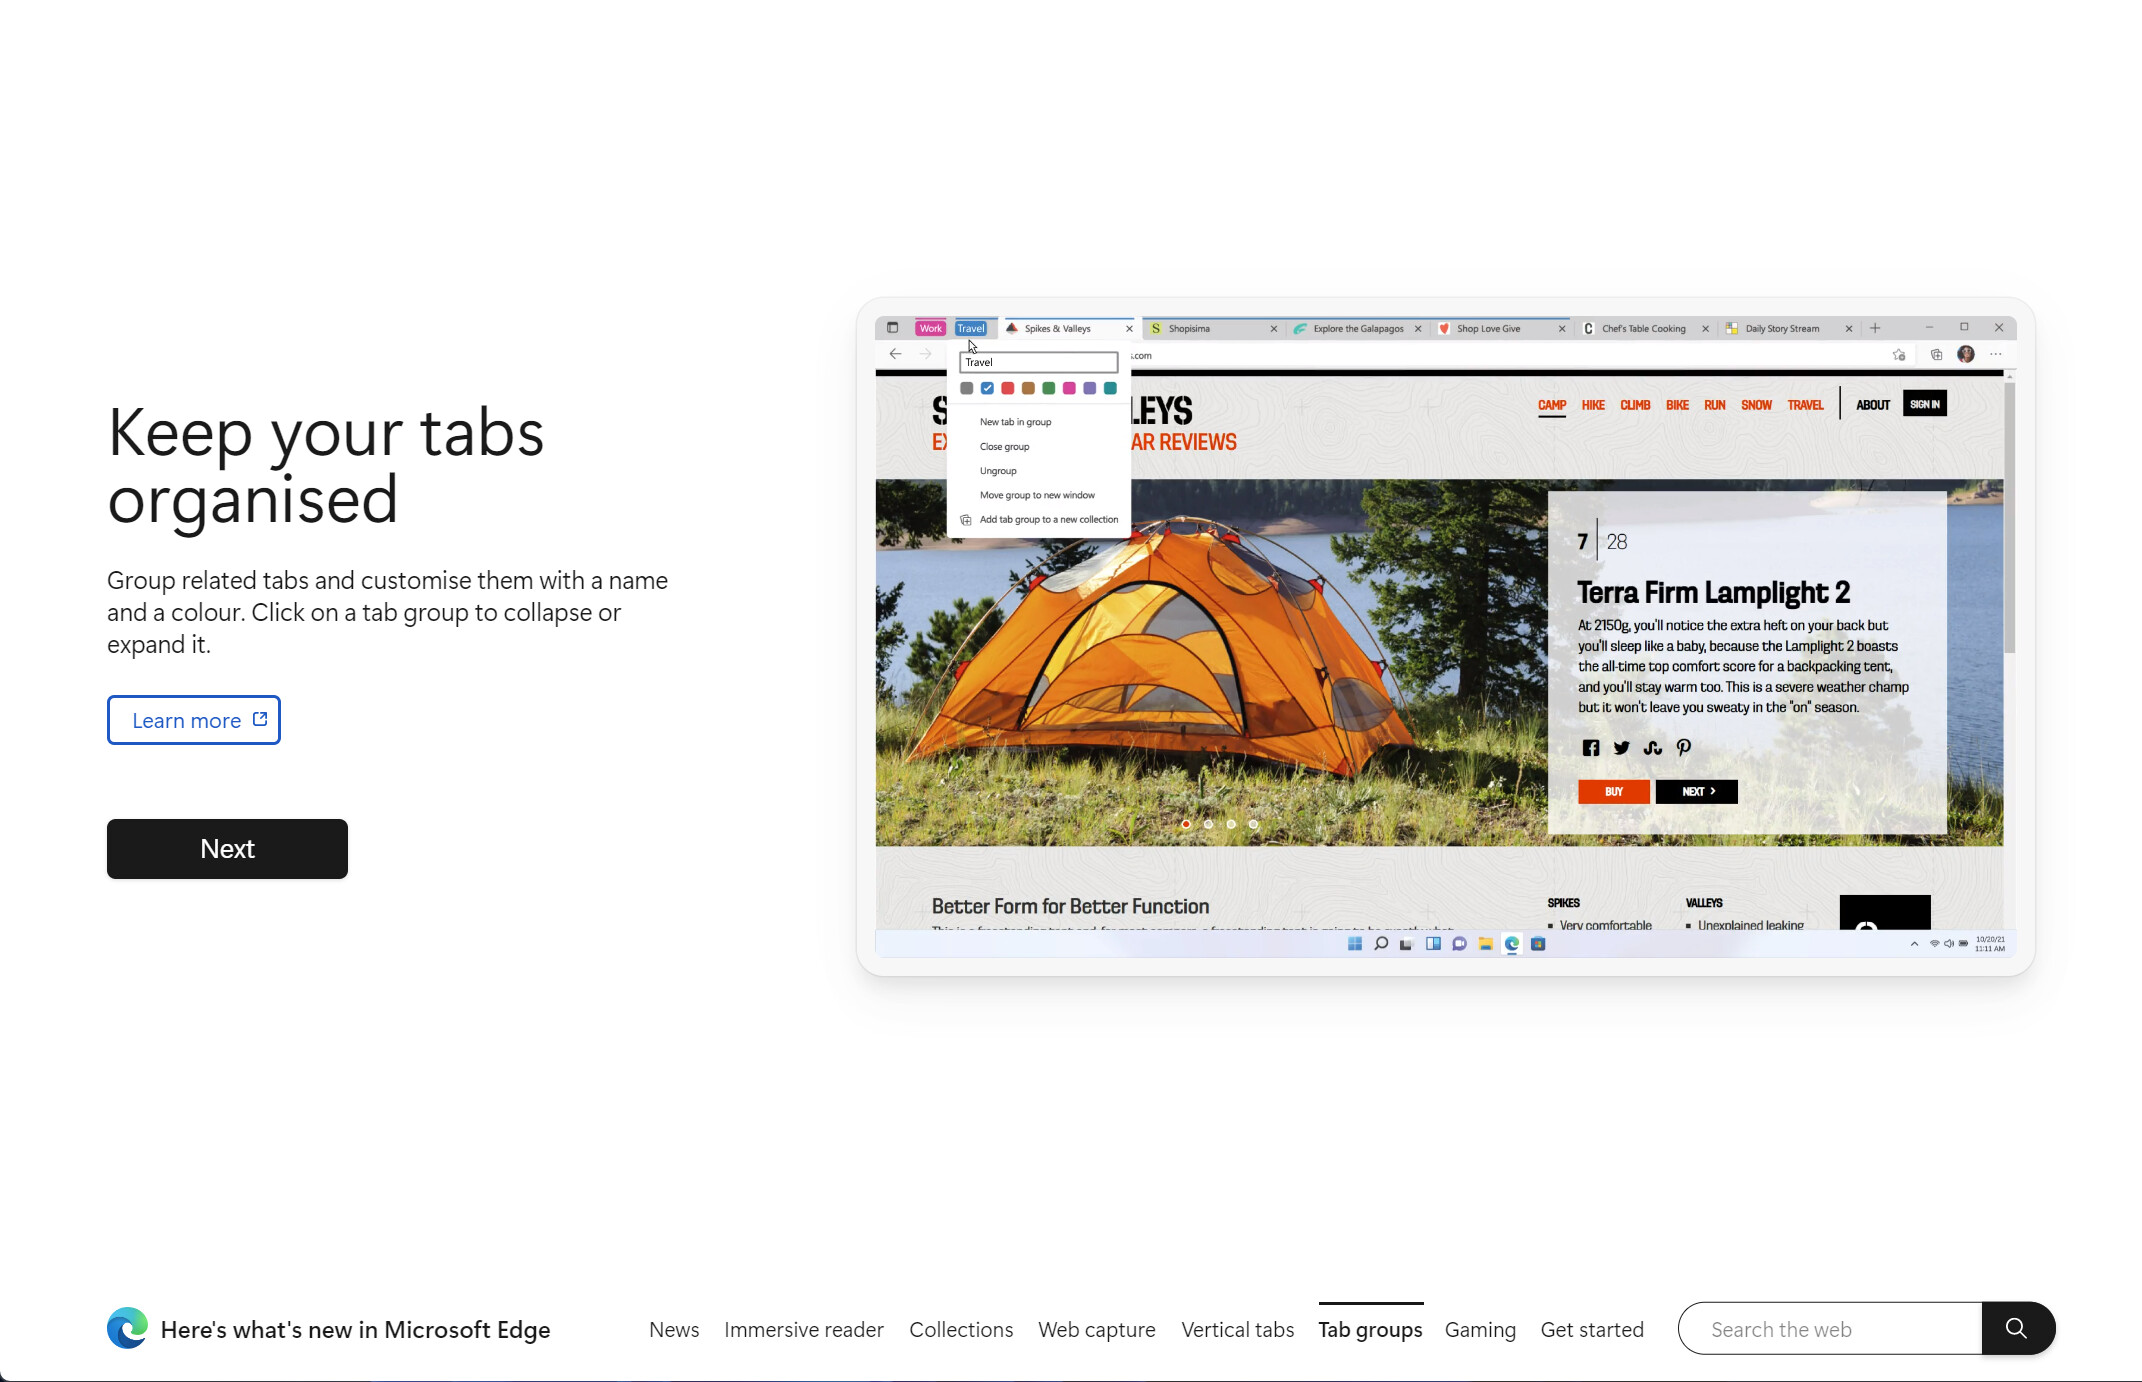
IDEA: Microsoft recently introduced Group Tabs to their MS Edge Browser, which is incredibly useful for organising tabs. I thought that this would also be a great feature for Optuma. The way it works is that you can create a group tab that can be used to organise a group of related tabs. You do this by clicking on ‘add to group’ when creating a new tab. This kind of feature in Optuma would add another overarching layer of organisation, which would improve its research/organisation capabilities. See the pics attached.
RATIONALE:
- Keep Track of Lots of Tabs: Group Tabs would help people who have 50 chart tabs open in their workspace, making it easier to create group them by idea or commonality. For example, I might create group tabs by qualitatively oriented criteria that affect particular stocks; for example, Group by Chart Pattern: 'Double Top' or Group By Workflow: 'Review Tomorrow' or Group by Trigger: 'Gann Square Completing' or 'Natal Mercury in Retrograde'.
- Reduce No. Charts in One Workspace: Another reason for a Group Tab, is that you can only fit so many charts in a workspace before it is difficult to manage. An additional level of organisation would overcome this, and enable charts that belong together to be together, but not necessarily in the same tab.
- Greater Breadth in One WorkBook: A third reason for Group Tabs is that it would help you avoid the need to close one workbook when you haven't got what you need in front of you in the current workbook. This becomes important when you are trying to compare ideas for research purposes or bring together the various elements of a trading plan. You might be able to do this for one stock in a workspace, but what if you have multiple trading plans or are working on comparing lots of ideas as listed above? You really have to create another workbook to achieve this.
I hope you will consider my idea and appreciate the opportunity to put it forward.
Chris
[attachment file=“69545”]