In my new analysis, I have monthly data and would like to color the data line red from July 1997, for example. The particular problem here is that the start of the new color falls on a selected month and not on the start of a new year.
Using the following script would color the line at the beging of 1998.
YEARNUM() > 1997
If I use the following script, only the months July, August, September, October, November and December of each year are colored differently.
MONTHNUM() >7 and YEARNUM() > 1996
What is the correct script to color the data line red from July 1997?
I have already tried to change the custom color to match the chart background, but I am using the “Theme -> Light” setting and have disabled the “White Chart Background” property, so I have a light gray background and there is no gray color available to match the light gray background.
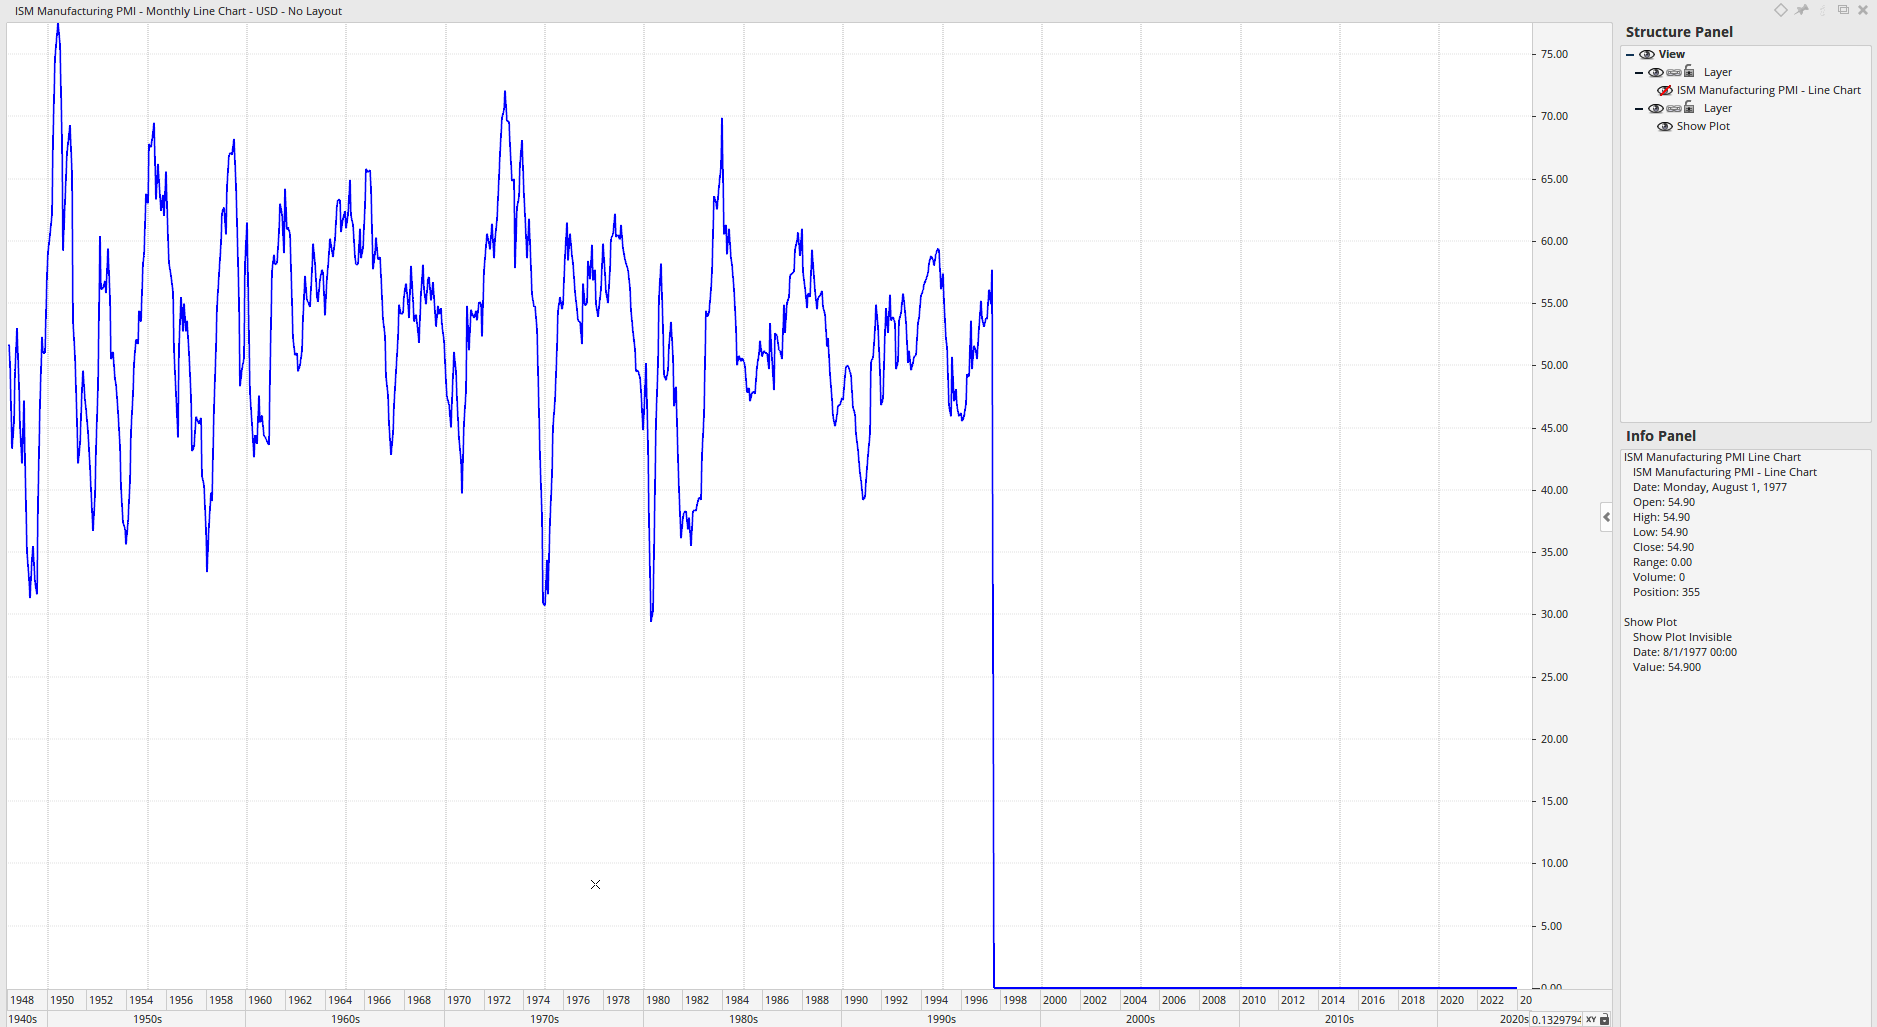
Is there a scripting solution to make the green line invisible?
Try this in a Show Plot with the PMI chart made invisible in the Structure Panel. The GETDATA function in P2 needs to reference the data series in red:
As you can see it works! But I get a vertical line to “0” and a horizontal line at “0”.
Can this vertical and horizontal line removed?
Can you please give me some information about the following code line:
P2=GETDATA(CODE=DATA2);
What does “CODE=DATA2” mean?
Addendum
Congratulations on your new forum website. A lot of new functions and settings. It will take some time to get used to the new design.
The old design was simpler and clearer. But from an administrator’s point of view, the new design is certainly better in order to better meet the legal and especially the privacy settings.
In any case, the new design is considerably more flexible than the old one, which is clearly demonstrated by the changes between yesterday and today.
The ever-increasing complexity is the price we have to pay for ever more sophisticated systems, better performance and better privacy protection.