Hi
I am not super experienced with scripting, and hope someone can direct me to the suite of scripts that will best suit me to achieve the following. I see it as similar to the Hull MA colour change for up and down, the difference here being that I want to distinguish between a rising MA, from a flat MA and then over to a falling MA - flat not being horizontal, but rather being defined by a low Rate of Change parameter (to be defined - manually)
I have attached a sketch of what I am wanting to achieve
Thanks
David
Thanks David. Not only can you colour bars/candles as per your preferred criteria (see here for more info) but you can also customise the colours of your tools, which I think would be the best solution for you.
Click here for a video on customising bar colours.
So in your example, apply the moving average to your chart, and then under properties select Colour Scheme > Custom and use the following for an upward sloping 100-period moving average. The part you have to determine is the rate of change period, and the threshold to define what’s flat and what isn’t.
This example is using a change of the 100 period MA over 10 periods is greater than 30% as green, less than -30% as red, and black for “flat.”
Green:
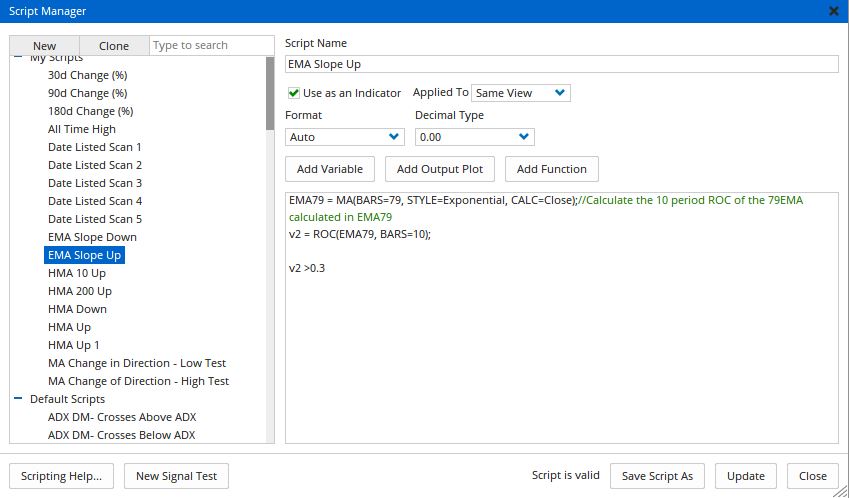
V1 = MA(BARS=100, STYLE=Simple, CALC=Close);
//Calculate the 10 period ROC of the 100MA calculated in V1
v2 = ROC(v1, BARS=10);
v2 > 0.3
Red:
V1 = MA(BARS=100, STYLE=Simple, CALC=Close);
//Calculate the 10 period ROC of the 100MA calculated in V1
v2 = ROC(v1, BARS=10);
v2 < -0.3
If neither of those conditions are true then the line will be drawn in black ie the top colour selected in the properties:

Once applied the moving average line will look like this:  You may need to adjust your moving averages and ROC values to suit your needs, but let us know what you think.
Hi Darren
I think you are a star. It worked a treat
I could have got there sooner if I had come back to the forum rather than relying on your email response. What happened and not your fault, is that I couldn't get a response to the nominated angle and so the line just displayed as all red, for example. What I couldn't replicate was putting > in the script line as shown in the email. I was on the point of giving up when I thought further about what 'gt' might be; lightbulb, short for greater than; then to functions; then found symbol >, and the rest is history
I have attached a copy of the script used in case you may have any comment
Thanks again
Regards
David
No worries David. Yep that looks good, so just use that for your preferred up colour in the custom colour scheme properties, and repeat for your down colour making sure to adjust the last line to v2 < -0.3.
Hi Darren
It works a treat on the D1 chart but when I go to a M60, or any of the multiples of 1 minute, the colours don't change to suit the rules. What other script instructions are required to get this to work on say a M60 chart?
Thanks
David
Hi David,
It’s because the 30% threshold for the change in the moving average is too high for the shorter timeframes. Change the last line to something like 5% (> 0.05) for 60 minutes or 1% for 1 minute and the colours can then be calculated.
Hi Darren
At least there is a way through, though inconvenient as what I do is have same chart but look at it from different time frames by changing time from D1 to H1 or M5 etc. The times I would choose from are D1, H4, H2, H1, M30, M15, M5 and M1
Therefore to accommodate this change in time frame and needing EMA79 to colour change at each of these changes in timeframe, how about creating a series of if statements for assigning a value to the ROC variable (presently 0.3 for D1) depending on time which goes along the lines of:
- if time = D1 then 0.3, and
- if time = H4 or H2 then 0.1, and
- if time = H1 0r M30 then 0.05, and
- if time = M15 0r M5 then 0.03, and
- if time = M1 then 0.01
Anyway, once the statements are set up I can play with the numbers for each timeframe to get the colour change response that I am looking for
Hopefully you can come up with an approach for me that I can work with
My next challenge will be setting up a scan that (along with a couple of other benchmarks) screens for 'green' or 'red' EMA79 at any of the above timeframes. But a step at a time
Thanks
David
PS
Would it have been better to set the test up on the basis of the CHANGE() function rather than the ROC() function for measuring the change in EMA value
Hi David,
If you click on the following link and view the last post made, there is an example there of how you can setup a script which applies different values based on the time frame being used:
https://forum.optuma.com/topic/conditional-script/
You should be able to adapt this for your own script, all you will need to do is identify the different variations in bar count for each time frame.