Hi all,
This is probably best explained using a screenshot…
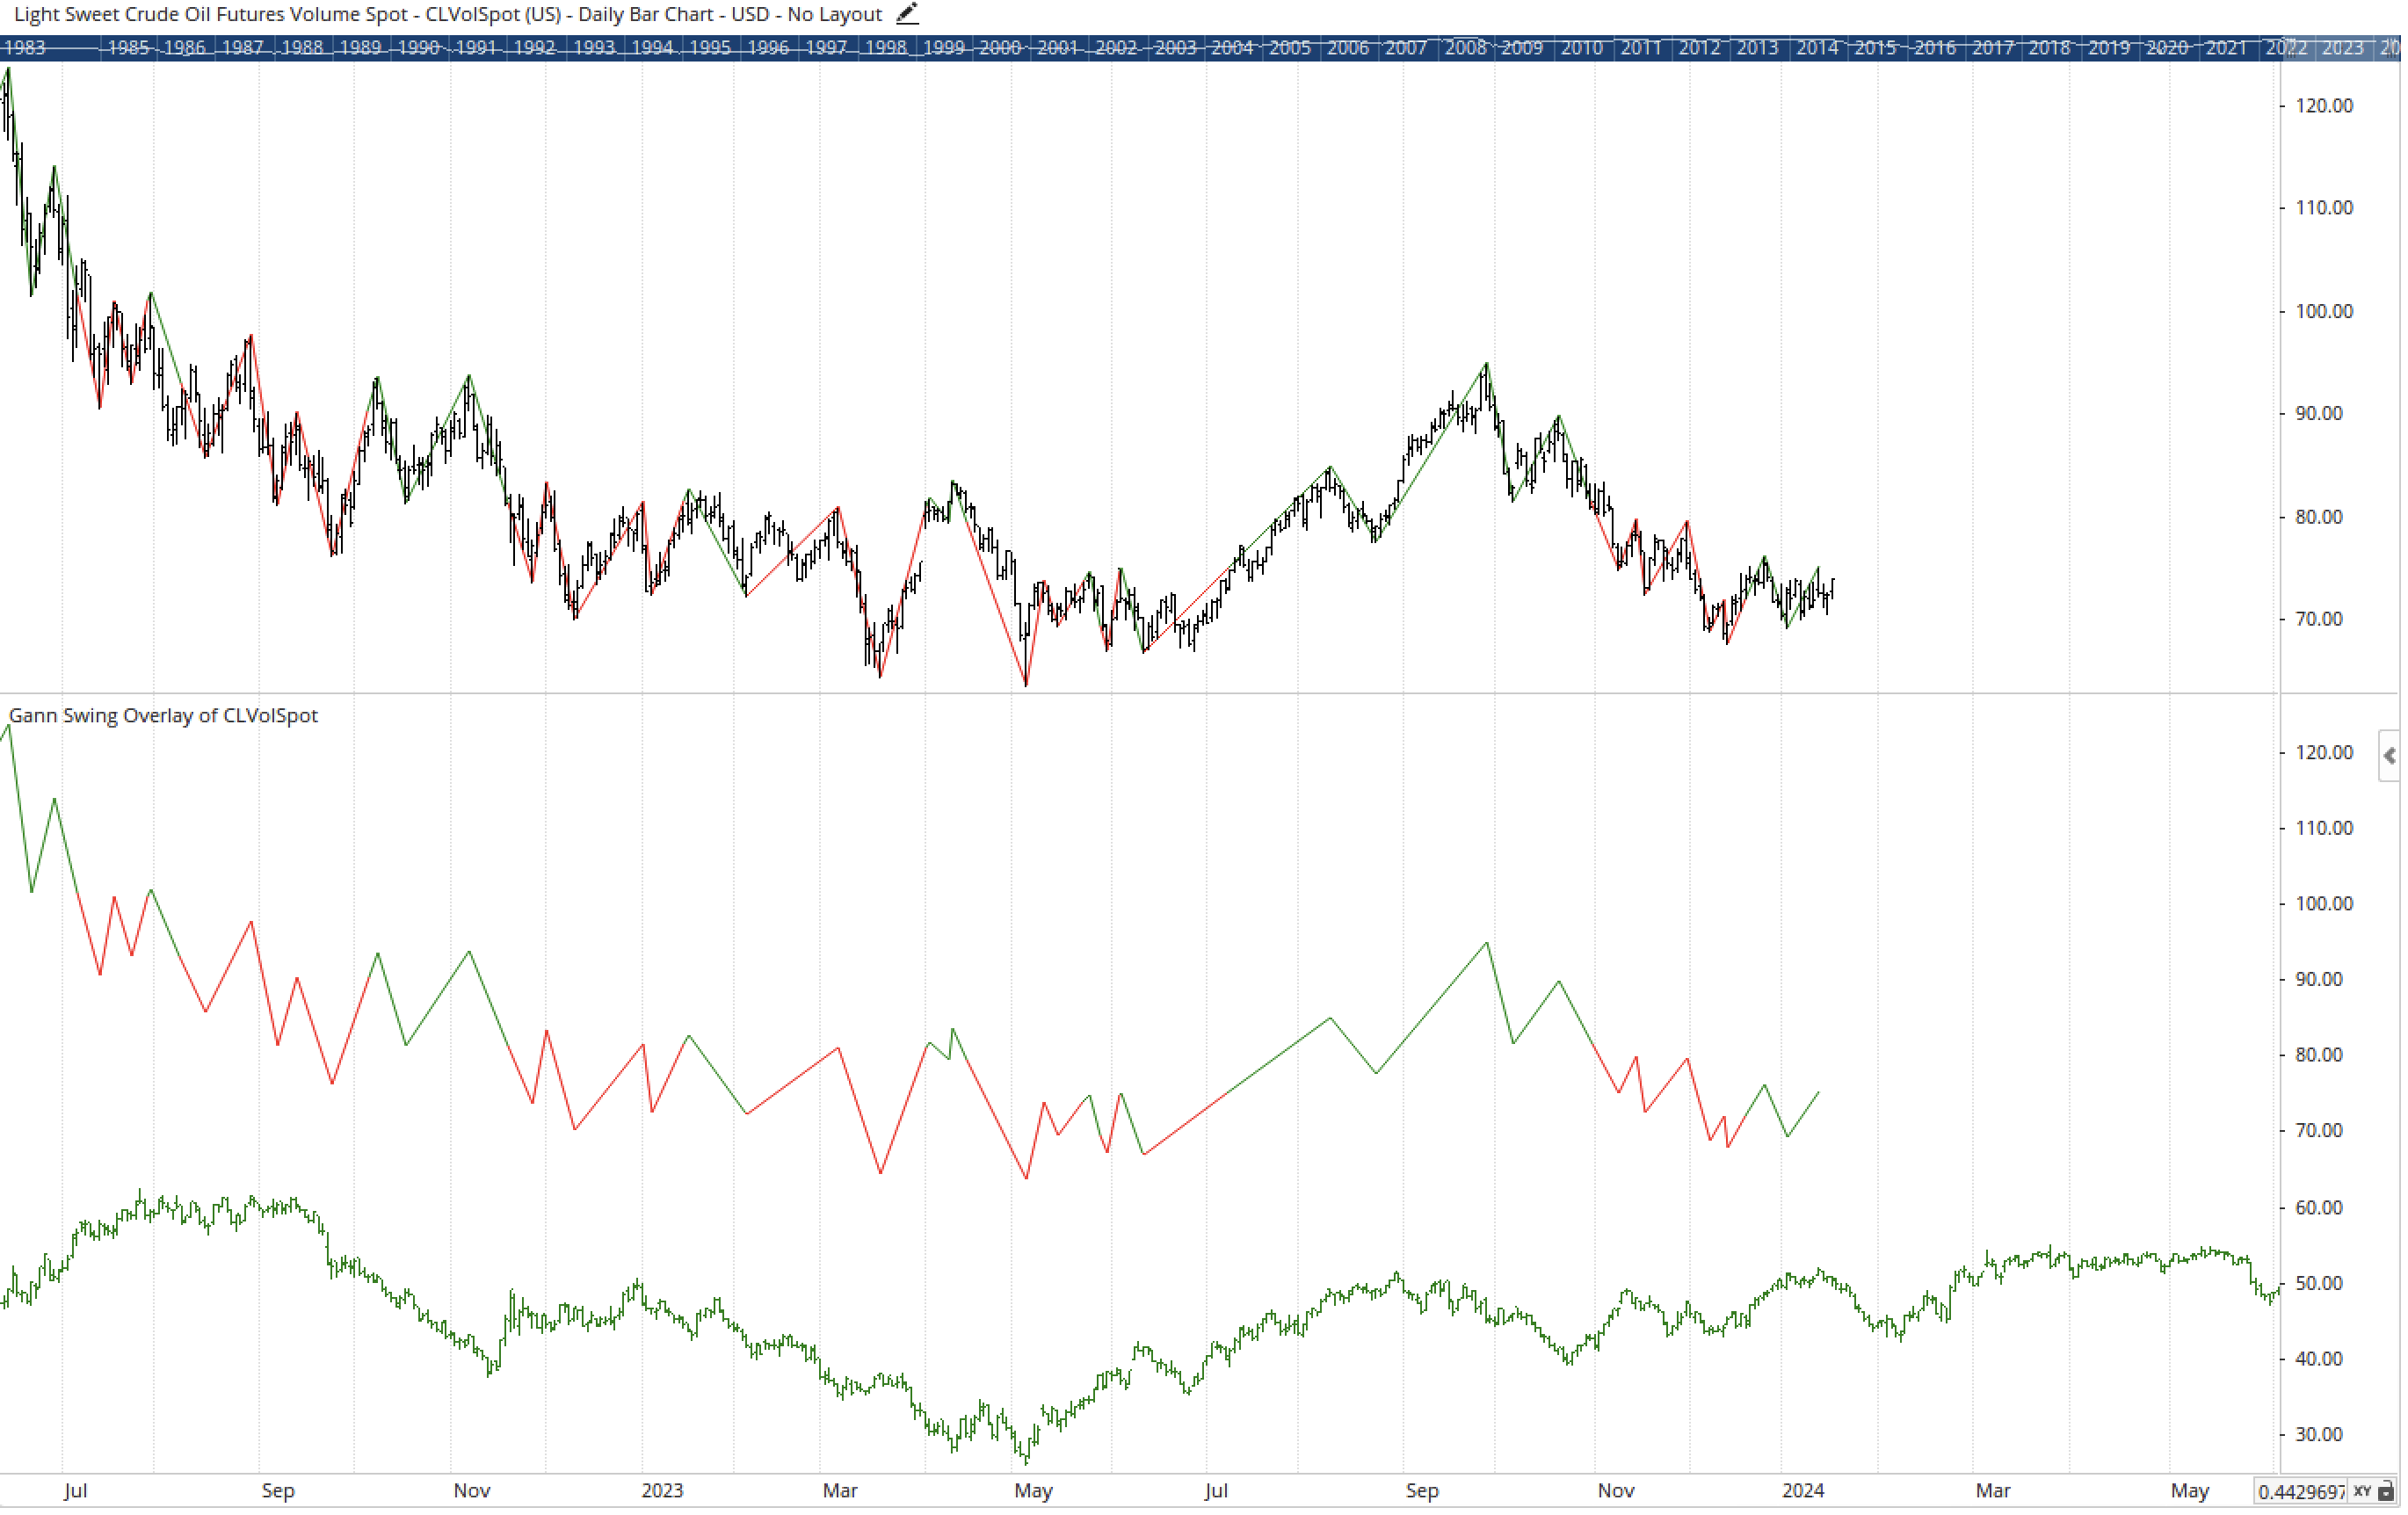
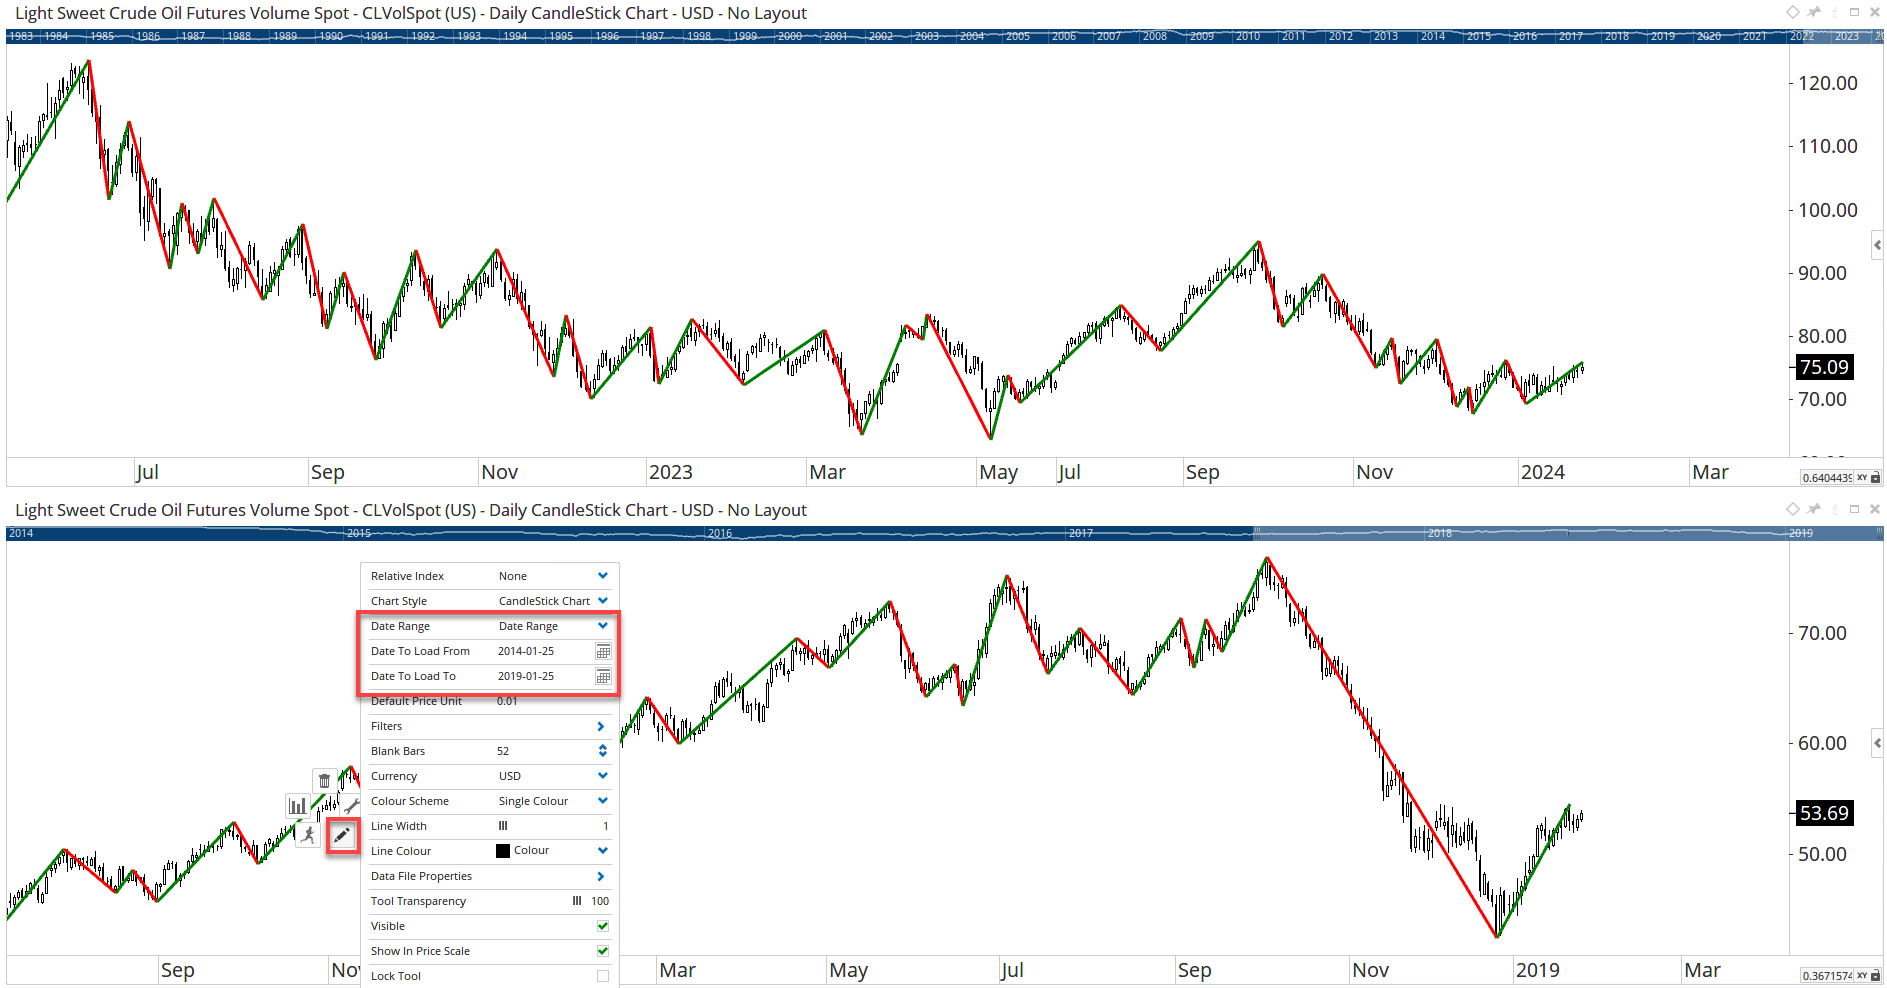
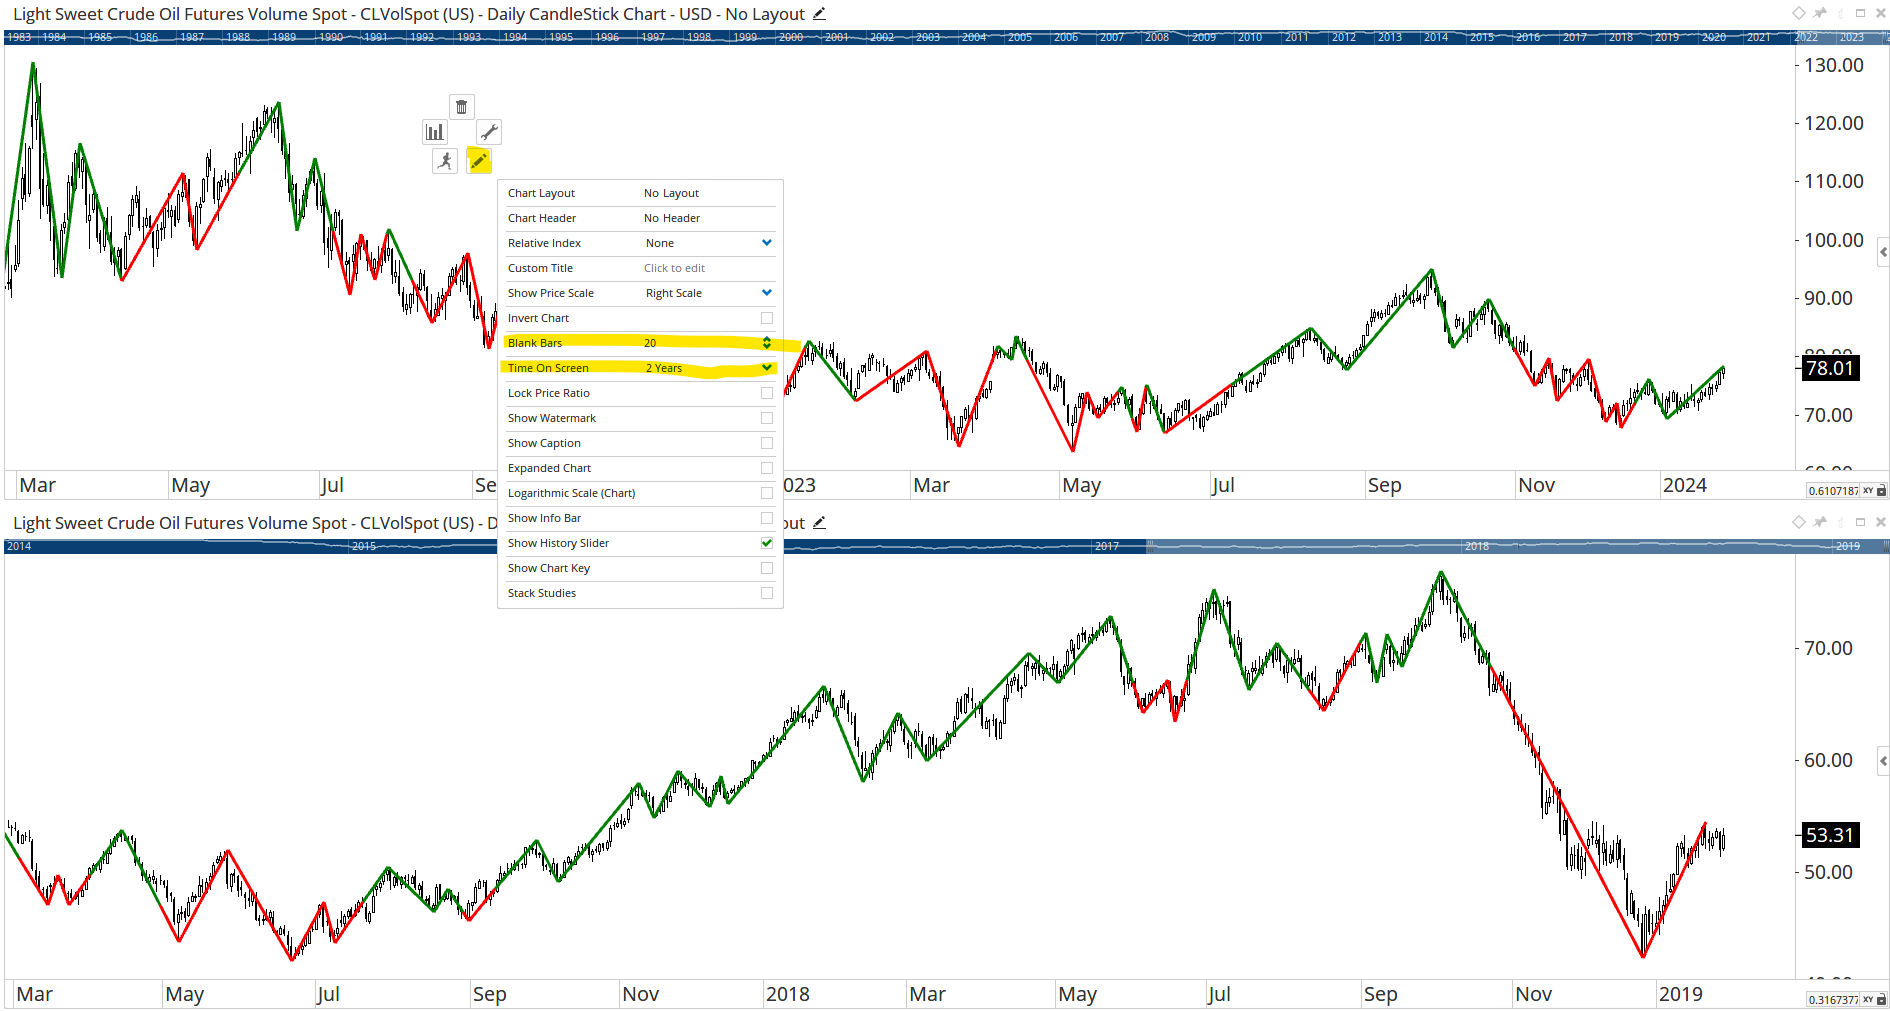
This chart shows a current bar chart for CL-VolSpot, above a bar chart for CL-VolSpot 5 years ago (using OFFSET=1820). You can see I’ve overlaid a 3 day Gann swing on the current chart, and tried to to the same on the bottom chart. Unfortunately there’s no OFFSET parameter available in GANNSWING(), so the lower GANNSWING is showing the current market rather than the market from 1820 days ago. If you look closely, the 2 swing charts are identical.
What I’d like to do, in the bottom chart, is draw the GANNSWINGs() that correspond to the bar chart from 5 years ago. To put it another way, if there was a GANNSWING(…, OFFSET=1820) option, that would be perfect - I’d put that over the bottom bar chart and the swings should line up exactly with the lower bar chart that’s offset by 1820 bars.
I tried something like this
offsetData = GETDATA(CODE=CLVolSpot:AFUT, offset, DATERANGE=Date Range, DATETOLOADFROM=1983-01-01,DATETOLOADTO=2019-01-19);
gs1 = GANNSWING(offsetData, SWINGCOUNT=3);
gs1
which initially seemed promising to create the GANNSWING() offset by 5 years, but then I’m not sure how to plot gs1 on the chart
Any tips would be very welcome! I’m open to using either Python or Pascal if it’s not possible to do using Optuma scripts