Hi,
I want create a script for the compound annual growth rate (CAGR).
The Excel formula is: =(end value/start value)^(1/periods)-1
or e.g.: =(((A11/A1)^(1/10))-1)
I want then chart the S&P 500 as a bar chart and in a window below the chart the CAGR values as a histogram with positive/negative settings.
Can give me some hints, how I can do this?
Thanks,
Thomas
Hi Thomas,
You can use the Power() function to achieve the result you are after. The following example can be used on a Daily chart to show the CGAR values (i’m using a 10 year comparison as per your Excel example, but you can adjust this script to use any other time frame):
//Get current and 10 year offset closing prices
V1 = CLOSE(Year(PERIODAMOUNT=1)) ;
V2 = CLOSE(Year(PERIODAMOUNT=1), 10) ;
//CGAR Calc
V3 = (V1 / V2);
$V4 = (1/10);
V5 = (POWER(V3,POWER=$V4) - 1)*100;
V5
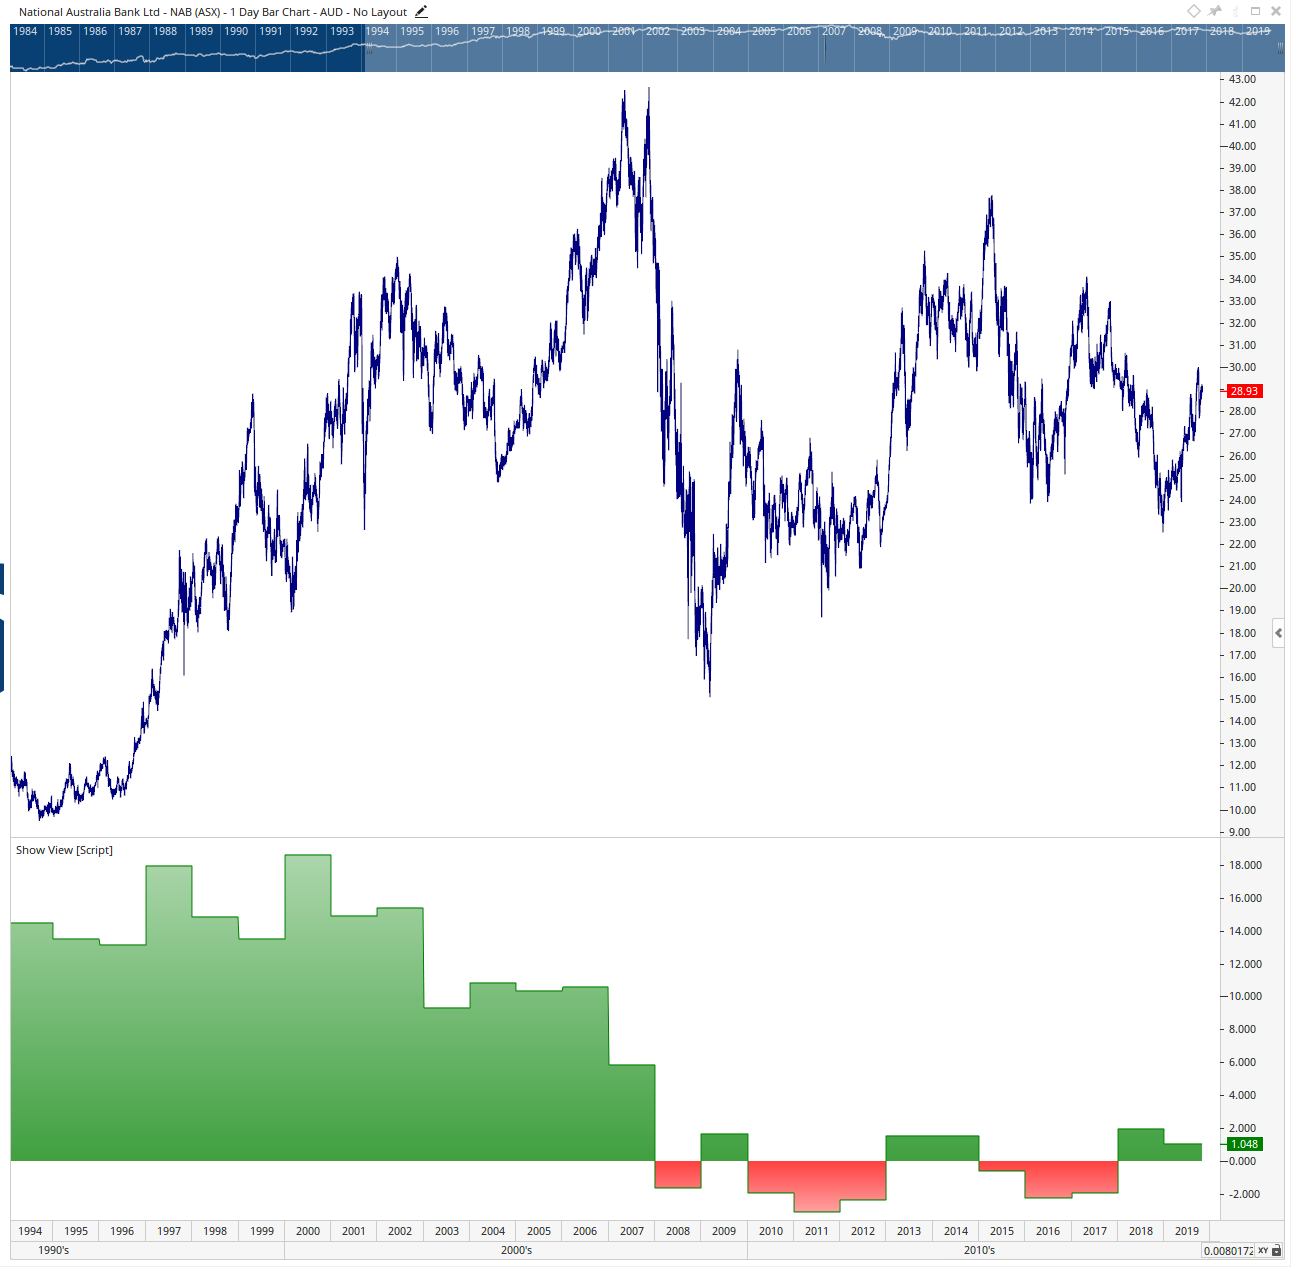
Here is an example of how the script works on a Show View:
Would the Annual Rate of Return function work as well?
Hi Michael,
as far as I know calculates the ARR only the return of one year, whereas the CAGR measures the average return per year over a given period of years.
You can search in the Internet for ARR or CAGR, there are a lot of examples for both.
Annual Rate of Return may do what you need to, i had a quick look and the values appear to line up with my manual script year to year:
https://help.optuma.com/kb/faq.php?id=1112
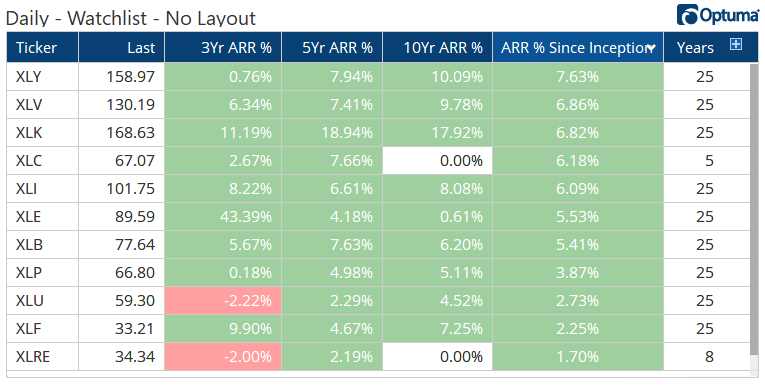
To calculate the CAGR since inception:
//Calculate number of trading years;
Y1=LAST(YEARNUM()) - FIRST(YEARNUM());
//Get current close and first open prices;
V1 = CLOSE() ;
V2 = FIRST(OPEN());
//CGAR Calc using the number of trading years;
V3 = (V1 / V2);
$V4 = (1/Y1);
CAGR = (POWER(V3,POWER=$V4) - 1);
CAGR
In this example for the SPDR Sector ETFs, Consumer Discretionary $XLY has gained an average of 7.63% over the last 25 years, compared to only 1.7% for Real Estate $XLRE over the 8 years it has been trading. However, when looking at the 3 year ARR % column, Energy $XLE leads with 43.4% per year, with -2.2% for Utilities $XLU.