Hello,
I am trying to create a script that can identify when price has consolidated/formed a base and then begins to breakout to the upside. I was thinking of possibly using slope of MA’s as the main signal, where the longer MA (100, 150 or 200 day) is relatively flat but then the shorter MA (50day) has begun to slope upwards.
I was using the below to identify slope… should I be adjusting Timeframe to something other than “Default” and do I need to adjust the number of bars to match that of the MA and ATR for MOMENTUM (it defaults to 10)?
//50MA Slope
v1 = MA(BARS=50);
v2 = ATR(BARS=50);
MOMENTUM(v1)/v2
//150MA Slope
v1 = MA(BARS=150);
v2 = ATR(BARS=150);
MOMENTUM(v1)/v2
Thank you,
Andrew
Hi Andrew,
When timeframe is default it will use the timeframe of the chart / watchlist / scan that is being used, ie a weekly chart will calculate a 50 week MA. Note that you can’t go down a timeframe (ie calculate a daily 50MA on a weekly chart) but you can calculate a weekly or monthly MA from a daily chart.
Your formulas will create a value, so you can make it a true / false to signal when the MA50 crosses above 0 and the MA150 value is within +/-0.5 by combining your formulas.
With regards to momentum, that is the number of bars you are looking back, so you can try with different lengths if 10 is too short. This example is using 21 bars, ie a month:
v1 = MA(BARS=50);
v2 = ATR(BARS=50);
v3 = MA(BARS=150);
v4 = ATR(BARS=150);
MOM1=MOMENTUM(v1, BARS=21)/v2;
MOM2=MOMENTUM(v3, BARS=21)/v4;

MOM1 CrossesAbove 0 and
(MOM2 > -0.5 and MOM2 < 0.5)
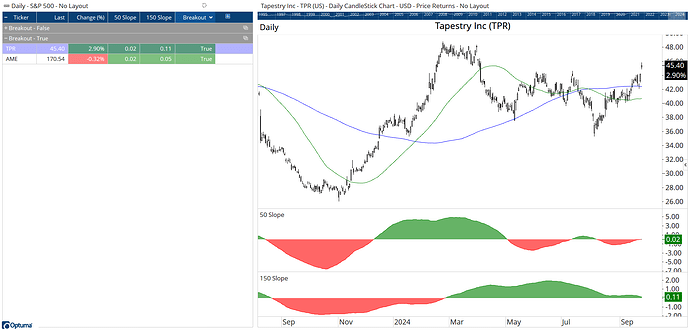
So today TPR and AME passed (using daily data):
