The custom Market Breadth module has the ability to create a measure based on any technical criteria that can be defined with a script formula. The only requirement is that the script must return either a true/false response (e.g. is the 34 period moving average sloping up?), or a calculation that can be measured (e.g. how far is the close below the ?) Each of these will return result for the selected universe (eg S&P500 companies, or your portfolio) and will show the result as either a percentage, a count, a sum, or an average.
This is a companion discussion topic for the original entry at https://www.optuma.com/kb/optuma/data/custom-market-breadth-module
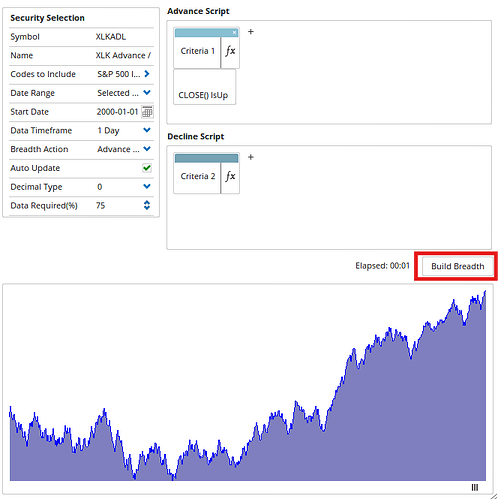
Here’s how to build custom advance / decline lines for a universe of stocks, such as the S&P500 Tech sector:
Symbol: XLKADL
Name: XLK Advance / Decline Name
Codes To Include: S&P 500 Info Tech Index from Optuma Symbol Lists
Start Date: It’s best to use a fixed date (so the values don’t change when using a rolling date eg Last 5 years)
Data Timeframe: Daily (change to Weekly to be based on weekly advance / declines).
Breadth Action: Advance / Decline Cumulative Line
Advance Script: CLOSE() IsUp
Decline Script: CLOSE() IsDown
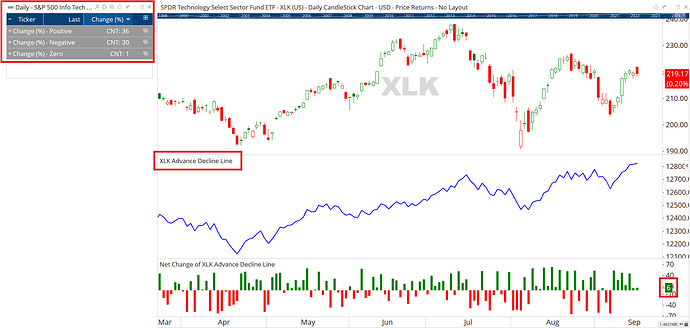
Once the breadth has been built the symbol XLKADL can be used in a chart or watchlist. It can also be used in the Breadth Data tool to display below the price chart. As seen below, today the XLK was down 0.2% but the Advance / Decline Line in blue was up 6 (confirmed in the watchlist linked to the sector symbol list, which shows 36 members advanced and 30 declined, matching the net change).
If you have access to the Custom Breadth module, save the attached .obe file here and then build the data under Data > Market Breadth.
Documents/Optuma/Local/Breadth
XLK Advance - Decline Line.obe (1.3 KB)
Other sectors:
XLY Advance - Decline Line.obe (1.3 KB)
XLV Advance - Decline Line.obe (1.3 KB)
XLU Advance - Decline Line.obe (1.3 KB)
XLRE Advance - Decline Line.obe (1.3 KB)
XLP Advance - Decline Line.obe (1.3 KB)
XLI Advance - Decline Line.obe (1.3 KB)
XLF Advance - Decline Line.obe (1.3 KB)
XLE Advance - Decline Line.obe (1.3 KB)
XLC Advance - Decline Line.obe (1.3 KB)
XLB Advance - Decline Line.obe (1.3 KB)
Save and open the workbook for the above example:
XLK Advance Decline Line.owb (52.6 KB)
1 Like

