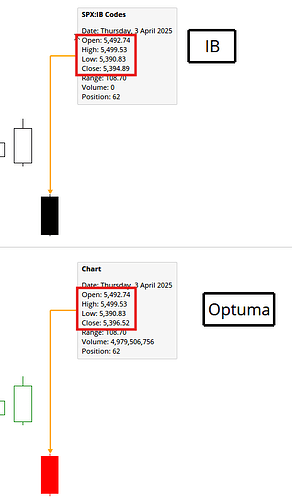
There is a huge discrepancy between the EOD OHLC daily data provided by IB and Optuma for the SPX last night. Firstly, huge opening gap for them both.
Optuma shows a dominant red candle with tiny tails top and bottom, while IB shows a similar range but with a much smaller body and a very long lower tail, suggesting rejection of those lower prices. The Optuma data suggests something quite different. This data is manifested many hours after market closure, suggesting the exclusion of after market trading as a possible cause.
Hi Bill I just opened charts of SPX with data from IB and compared it to our EOD data, and they are both have the same OHL, - just a slight discrepancy for the closing price (ours is correct when compared to the official close, whereas the IB data matches what they have in TWS).
Right-click on any candle before yesterday and select Clear Cache to this Bar from Actions to request the data from IB again, and see if it gets fixed.
