I would like to create a scanning script for Divergence using RSI 14 on AU stocks, Daily and Weekly charts, your assistance would be appreciated.
Thank you
Regards
Joe
I would like to create a scanning script for Divergence using RSI 14 on AU stocks, Daily and Weekly charts, your assistance would be appreciated.
Thank you
Regards
Joe
Joe,
I’m looking for a simalair divergence scanning script using a different indicator. Did you have any luck finding a script that works? If so, can you share your solution and I can try to modify to fit my needs?
Your help would be greatly appreciated.
Regards,
Dave
Note that you cannot use the pivot function for testing as it will give misleading results. It works great for scanning though.
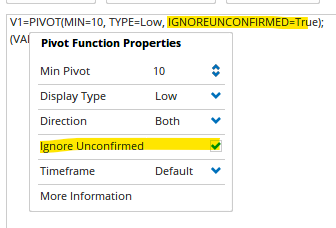
The Pivot function now has the ability to use confirmed pivots only, thus ignoring the latest label that is subject to change as new data comes in:
However, we may be able to improve on a divergence formula by comparing the linear regression slope of the price vs indicator… I’ll see what I can come up with.
Thank you Luke for posting the link of RSI divergences scripts.
How do I modify this script in order to change it to MACD combo divergences scripts? reposting the link here : Identifying Divergences. Many thanks
No worries. For scanning, try this as an example.
//Negative MACD histogram divergence
//Get the MACD value
M1 = MACD(DEFAULT=Histogram);
//calculate 20 pivot MACD high
P1 = PIVOT(M1, MIN=20, TYPE=High, IGNOREUNCONFIRMED=False);
//get value of the MACD peak
V1 = VALUEWHEN(M1, P1 <> 0);
//Is MACD high 4% lower than previous?
Sig1 = V1 < V1[1]*0.96;
//get stock high value at MACD peak
V2 = VALUEWHEN(HIGH(), P1 <> 0);
//Is stock high 4% higher than at previous MACD peak?
Sig2 = V2 > V2[1]*1.04;
//Show when MACD has lower high & price higher low
Sig1 and Sig2
Hi everyone,
Try this formula that uses the LRVAL() function that was added in 2.2 to compare the linear regression slopes of price vs RSI (change variable V1 to MACD if you want to use that instead).
//For NEGATIVE divergence;
//Get indicator value;
V1=RSI(BARS=14);
//Get linear regression slopes of price and indicator;
P1=LRVAL(BARS=22);
P2=LRVAL(V1, BARS=22);
//Signal when slopes are in opposite direction;
//(adjust values to change slope tolerance);
P1>0.3 and P2<-0.3
Change the last line to P1<-0.3 and P2>0.3 for positive divergence.
Currently there are 56 stocks in the S&P500 with a negative divergence: