Hi Steve,
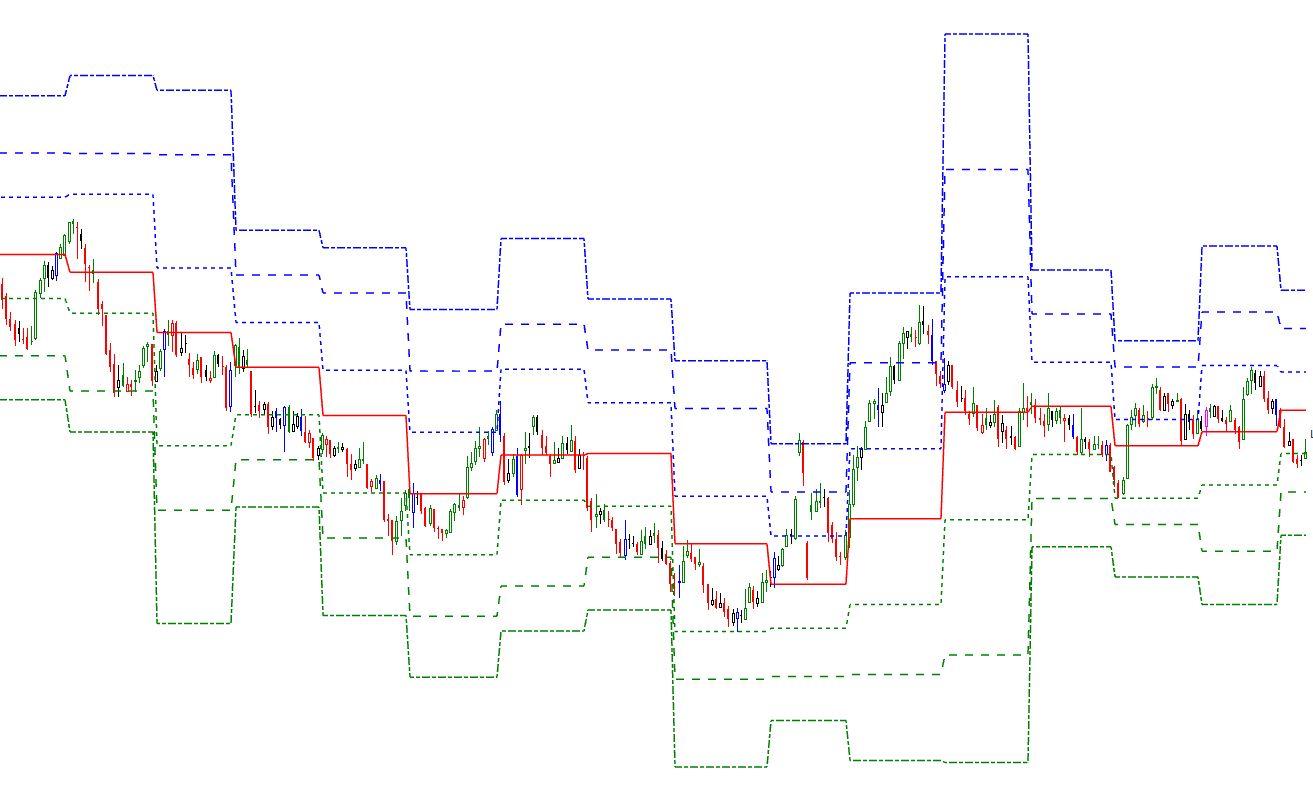
I'm guessing that this is what you were hoping to see:
The first issue with your scripts is that you've assigned variable codes, R1, R2, R3 S1, etc that are the same as parameters used in the PIVOTS() function, eg PIVOTS(DEFAULT=R1, PIVOTS=Monthly) . This will cause the Function to try and call that variable of the same name - a No No! Thus I've started all those variables with a "v" to distinguish them from the function parameters.
Next you need to define the Plots you wish to display. So here is the script code that I used to generate the above chart with SHOWPLOT tool calling the script:
// Steve Script - Script Forum #51575 20190312
PP = pivots(PIVOTS=Monthly);
vR1 = pivots(DEFAULT=R1, PIVOTS=Monthly);
vR2 = Pivots(DEFAULT=R2, PIVOTS=Monthly);
vR3 = pivots(DEFAULT=R3, PIVOTS=Monthly);
vS1 = pivots(DEFAULT=S1, PIVOTS=Monthly);
vS2 = pivots(DEFAULT=S2, PIVOTS=Monthly);
vS3 = pivots(DEFAULT=S3, PIVOTS=Monthly);
Plot1 = PP; Plot1.Colour = Red;
Plot1.LineStyle = Solid;
Plot2 = vR1;
Plot2.Colour = Blue;
Plot2.LineStyle = Dash;
Plot3 = vR2;
Plot3.Colour = Blue;
Plot3.LineStyle = LongDash;
Plot4= vR3;
Plot4.Colour = Blue;
Plot4.LineStyle = DashDot;
Plot5 = vS1;
Plot5.Colour = Green;
Plot5.LineStyle = Dash;
Plot6 = vS2;
Plot6.Colour = Green;
Plot6.LineStyle = LongDash;
Plot7= vS3;
Plot7.Colour = Green;
Plot7.LineStyle = DashDot;
Incidentally, if you are wanting a result to use with a SHOWBAR, the final result of your script must not have a ";", all other lines in the script must have one.
Cheers
Trevor
The Auld Tyma at