Hi,
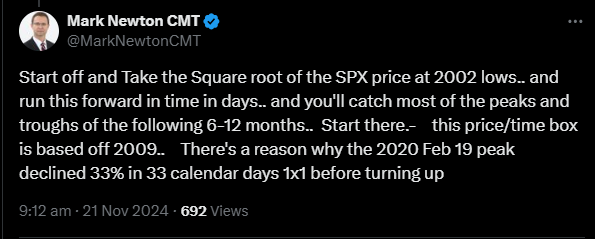
I have seen a very interesting chart about Gann’s squaring price and time by Mr. Mark Newton on your X account.
Here is the link: x.com
Here is the chart:
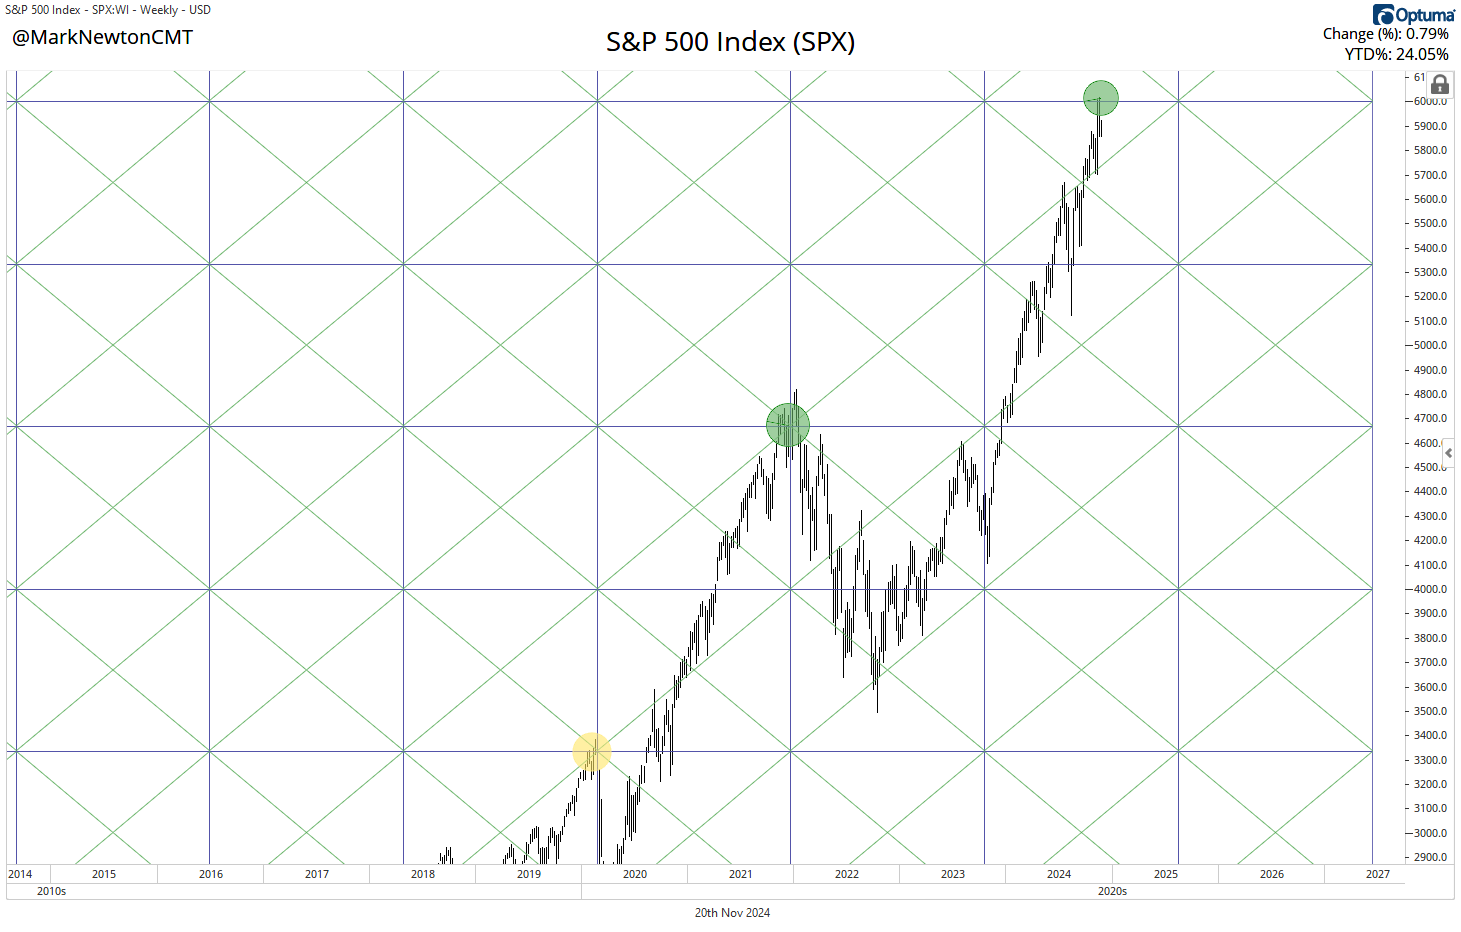
I have the Optuma Gann version, but I don’t know how to create this chart.
I would be very happy if someone could explain to me how this chart is created in Optuma.
Hopefully Mr. Newton won’t have a problem with me replicating his work.
Many thanks,
Thomas