I’m having trouble getting the Show Bar tool to point out exactly when the Gann Swing Overlay’s trend is up.
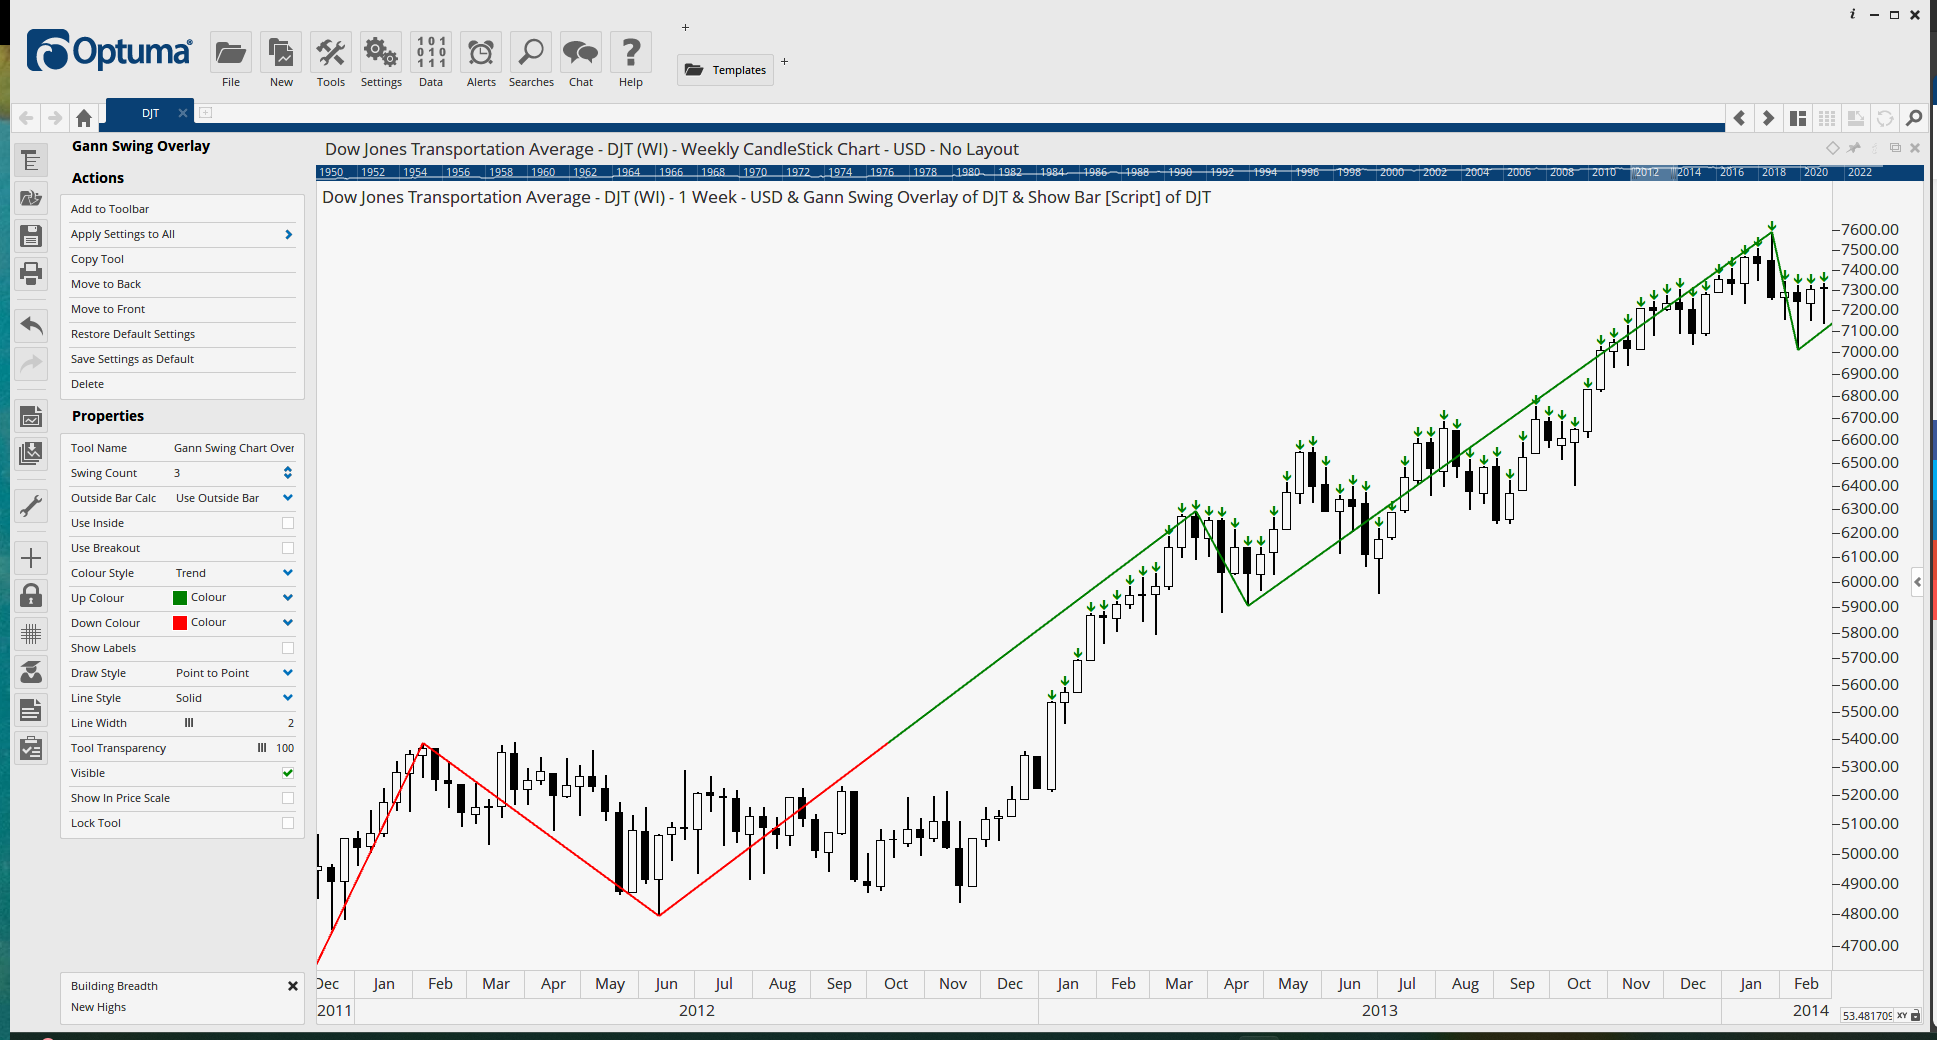
Chart 1 attached shows weekly bars with a Gann Swing Overlay. Swing Count 3. Use Outside Bar. Color Style is Trend.
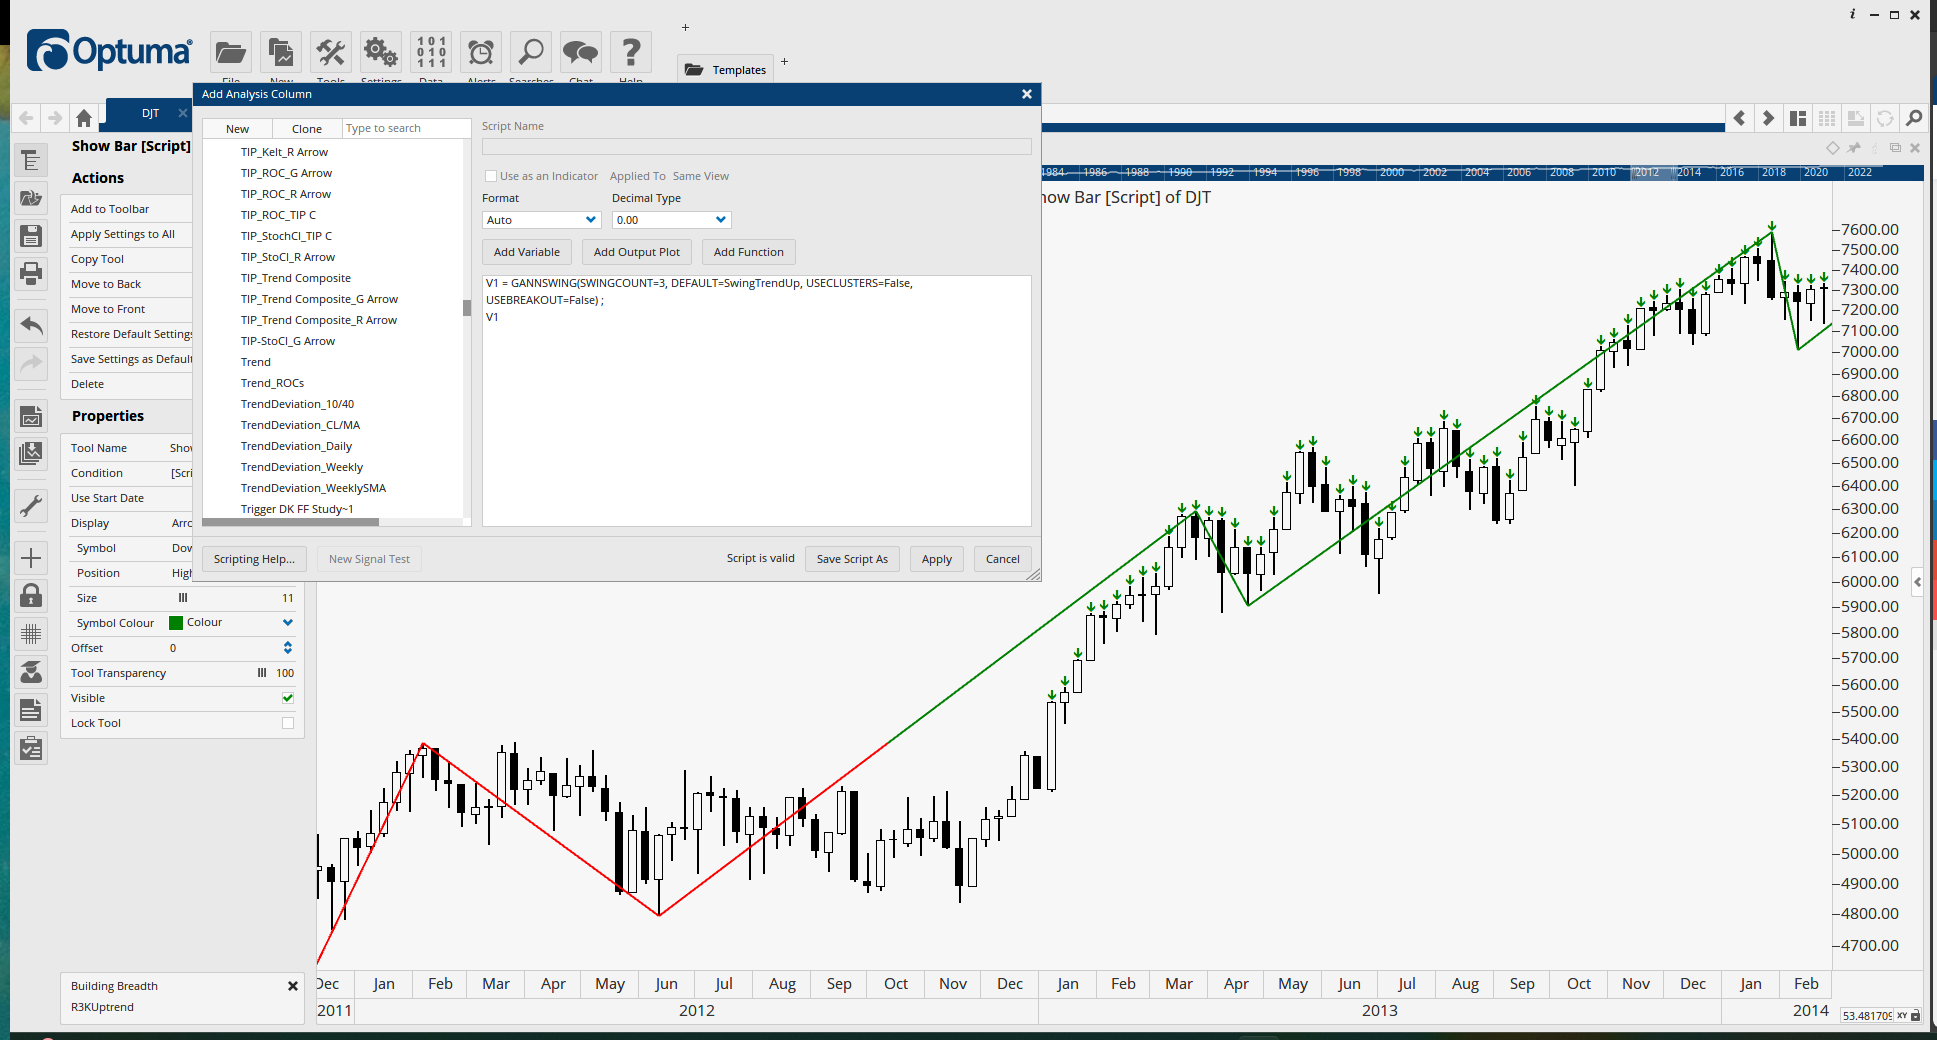
Chart 2 attached shows a Show Bar tool. Swing Count 3. Use Outside Bar.
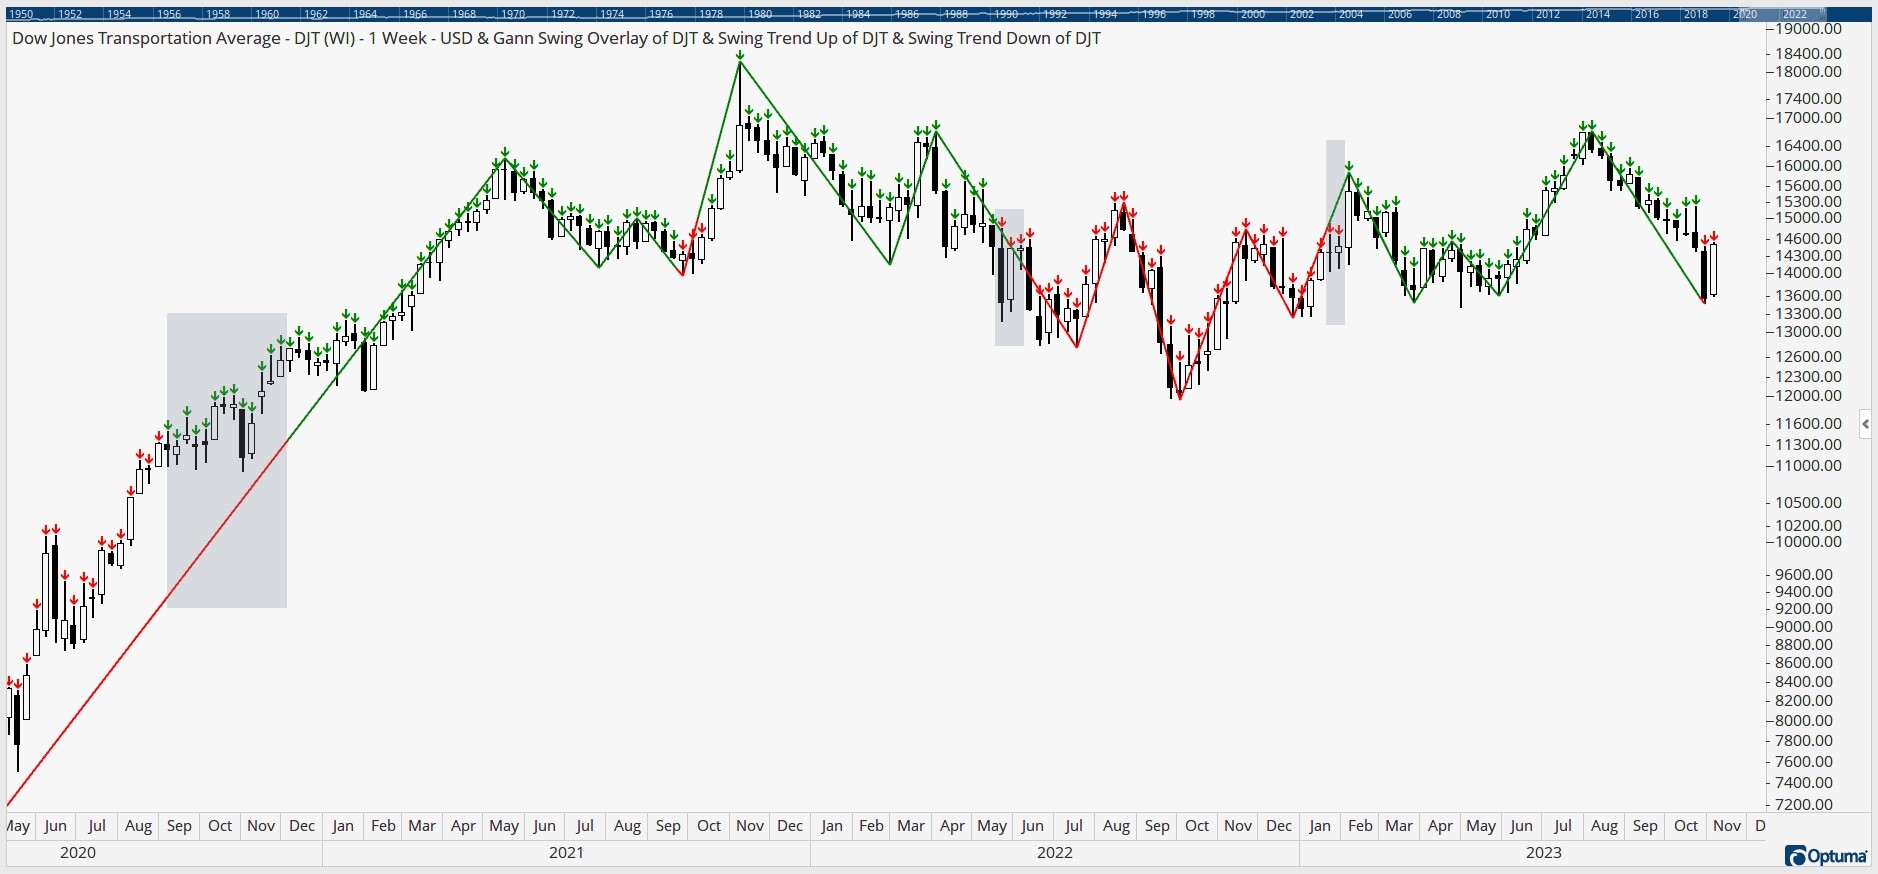
Why is the Show Bar not pointing out the first several weeks where the Gann Swing Overlay is already green?
The Show Bar marks the point at which the swing actually turned up, before that point the swing was unconfirmed. On the 4th of Jan 2013 when the close crossed above the previous swing top, the trend reversal of the swing was confirmed.
I have a weekly chart with a Gann Swing Overlay. I want to use one Show Bar tool to point out when the Swing Trend is Up, and another to point out when the Swing Trend is Down.
For the Gann Swing Overlay, the settings are:
Swing Count 3.
Use Outside Bar.
Color Style is set to Trend.
Here are the scripts I am using for the Show Bar tools:
Green Arrows -
Attached is the chart with rectangles showing the discrepancies. Please let me know what I am doing wrong. I want the colors of the arrows to match the Swing Trend color. Thank you.
The Show Bar script reflects the result of the trend as it appeared on that date. Using the example from January 2013, if I hide the data so the last bar is December 28, 2012, the swing trend on that date, with the bars at that time, the trend has not changed yet.
The Swing does not change until the next bar is added (Jan 4 2013) …
This is the date the Show Bar script marks, once the trend reversal has been confirmed. It matches the result you would have seen, without the future bars in place.
The GSO line will appear green at the point it moves above the previous swing top. As more data gets added the angle of the GSO line will change. It may be easier to visualise the point of the Trend Change using the Boxed Draw Style on the GSO rather than point-to-point.
I can confirm the script is returning an accurate result in line with the GSO.