hi all, would like help with a SHOW BAR script that will:
Color the price bars GREEN where:
- Price is above supertrend AND
- Price is above its 200 period DEMA
Colour the bars RED where
- Price is below supertrend AND
- Price is below its 200 period DEMA
Note - the formula for DEMA is below (which Ive created as an indicator already):
// Set lookback period;
#$LB=200;
//Calc EMA;
EMA1 = MA(BARS=$LB, STYLE=Exponential, CALC=Close);
//Calc EMA of EMA;
EMA2 = MA(EMA1, BARS=$LB, STYLE=Exponential, CALC=Close);
//Calc DEMA
(2 * EMA1) - EMA2
Hi Zac,
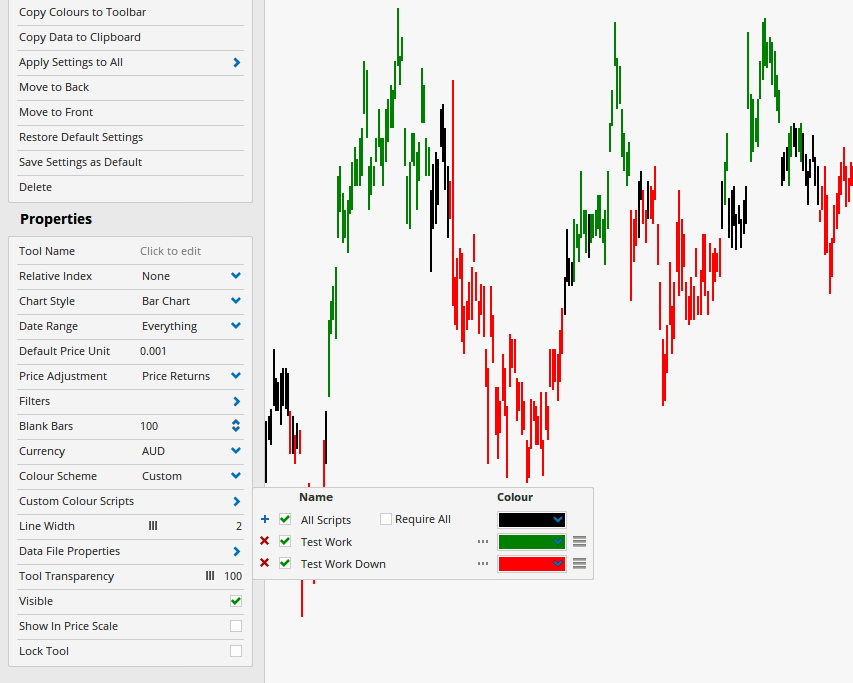
Pretty sure the easiest way is to set up two scripts, one which ends up with an if statement returning true for your green condition, the second with your red conditions as true. Then follow this https://www.optuma.com/kb/optuma/charts/custom-bar-tool-colours-controlled-by-script-formulas to set the bar colours
e.g.
//Calc DEMA
DEMA = (2 * EMA1) - EMA2;
//variables for clarity
aboveSupertrend = close() > ST();
aboveDEMA = CLOSE() > DEMA;
//first script
if(aboveSupertrend AND aboveDEMA, true, false);
**********************************
//Second script
//if( (NOT aboveSupertrend) AND (NOT aboveDEMA), true, false);