I am having trouble tracking breaks of lows with a counter and not sure where to go with this one.
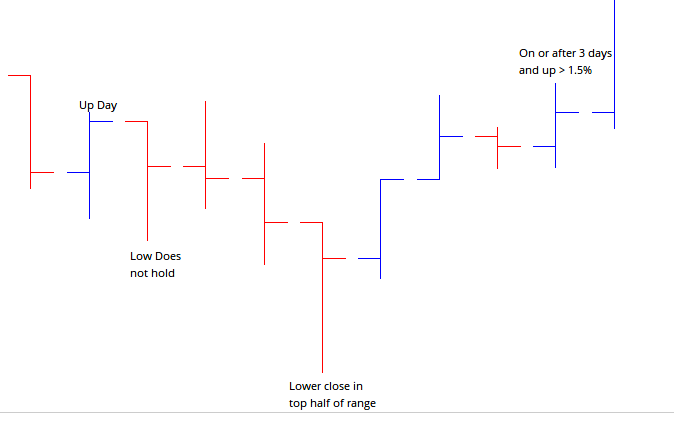
Start with a close below 200 MA, then I am trying to find an up day where the lower of either the low of that up day OR the low of the day prior becomes a low that needs to hold.
If that low does not hold, look for either another up day OR a down day that closes in the upper 50% of the range.
If this low holds, on or after 3 days, we are looking for a 1.5% up day. The low of the 1.5% up day now becomes the new low that needs to hold (Major Low).
I have attached a depiction below.
I would like to create a ShowView that depicts where these Major Lows start and stop with a +1 or 0.
I can’t think of a way to easily do that, but have you seen the Percent Swing Overlay tool and PERCENTSWING() script function? It calculates the % move from a low (and high) which might be able to be used for the 1.5% move - or do you need the1.5% to occur on one day?
This will show when the 1.5% swing turns up when below the 200MA:
V1=CLOSE()<MA(BARS=200, CALC=Close);
S1=PERCENTSWING(PERCENT=1.5);
R1= V1 and S1 TurnsUp ;
R1
Here’s an attempt to do that but it needs finessing as the 1.5% day can occur many days later by which time the low hasn’t held.
//Get Low when Close Above mid;
V1=BARTYPES().CloseAboveMid;
L1=VALUEWHEN(LOW(),V1);
//Is the Low lower than next 3 bars?;
S1=L1<LOW()[-1] and L1<LOW()[-2] and L1<LOW()[-3];
//Signal 1.5% change after 3 higher lows;
C1=CHANGE()>1.5;
SIGNALAFTER(S1,C1)
If you would like me to spend more time we can arrange a consultation. Let me know at [email protected].
If i’m reading this correctly. This is very similar to a well known way of looking at an Oniel “thrust” that identifies bottoms in the market. I use something similar in my process and have failed at scripting it and would be very interested in a solution.