I have searched the forum and not seeing this, but looking to create a scan whereby one can create an IBD style relative strength calculation that ranks stocks among themselves. The closest I am seeing is RIC (), but that appears to be done at an index level.
It’s not possible to perform a percentage rank in the watchlist (unless you export to Excel) but you can group the column by decile, quartile, or a defined number of bins.
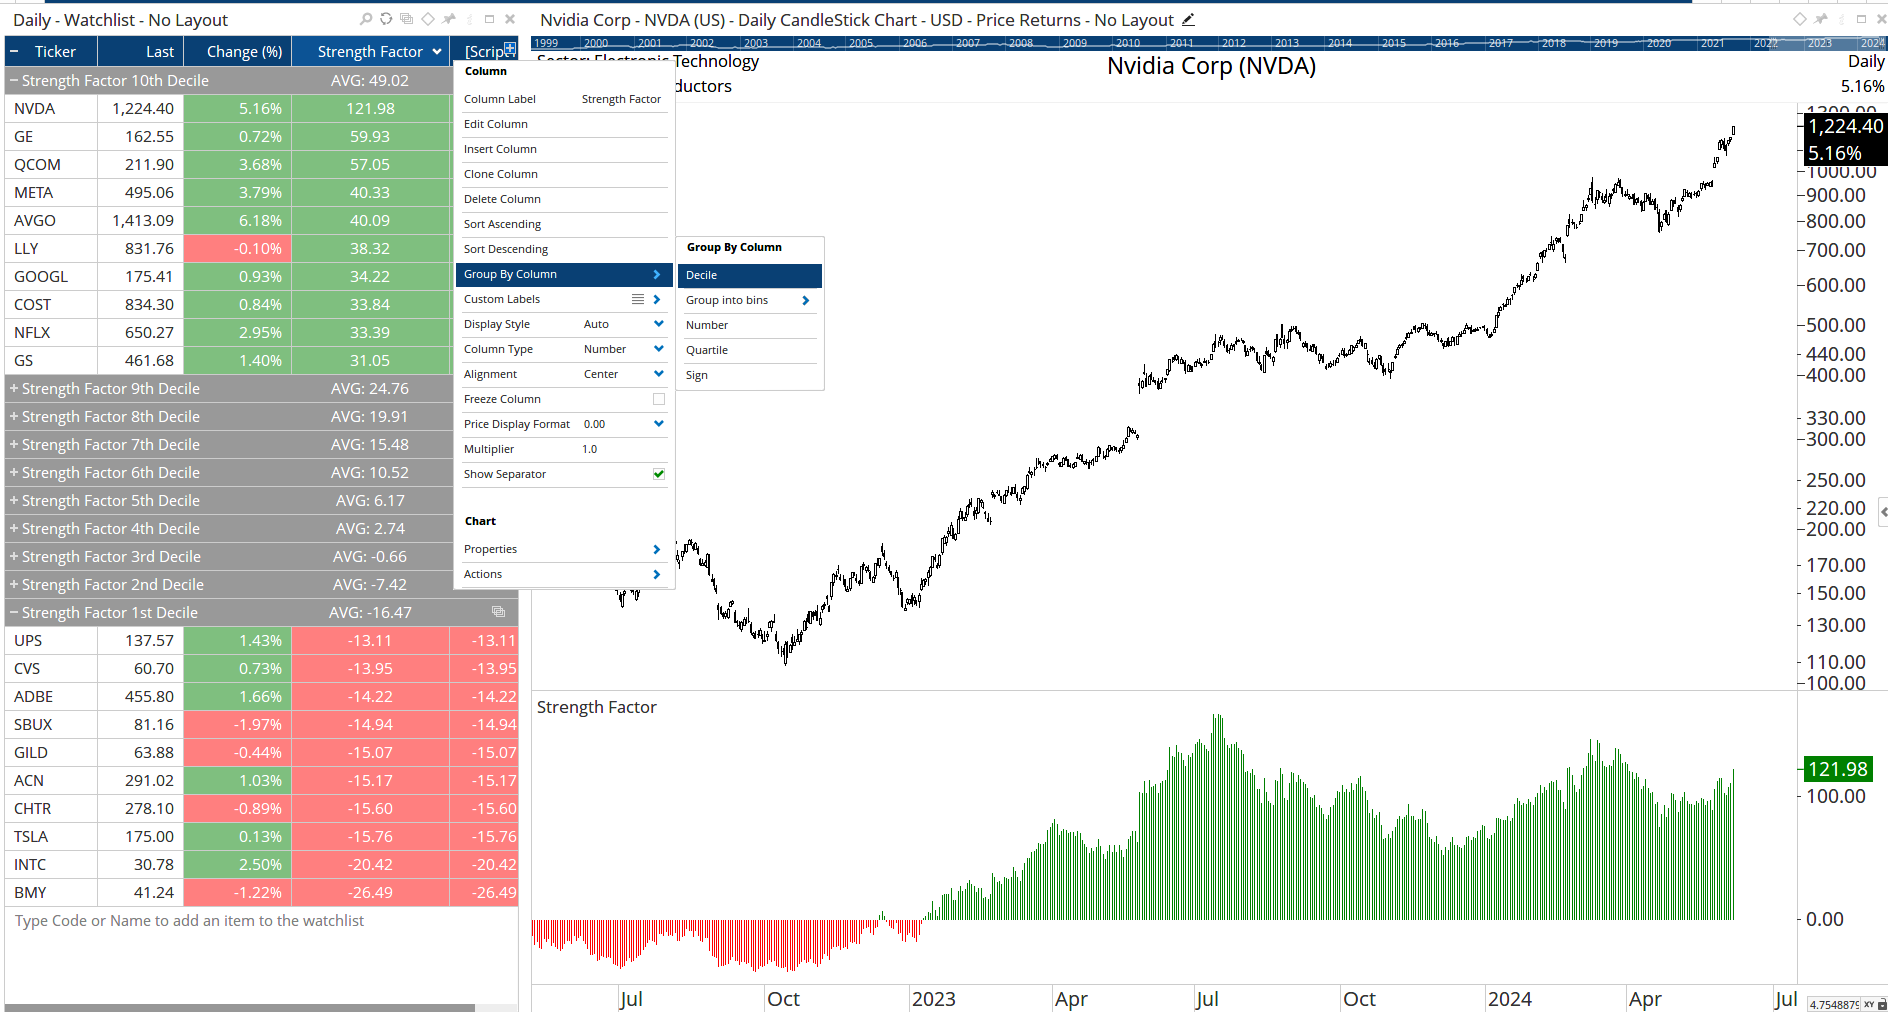
Save and open the workbook example for the S&P100 grouped in to Strength Factor deciles:
Coming back to this, is there any ranking function at all within the scanner? I prefer to scan across the entire US market and seeking to minimize the number of symbols that enter the linked watchlist.
You can use the Scanning Manager but it only returns true conditions, not a rank. So you would need to come up with a value to use as a cutoff, eg for a score above 50 use this:
You can then open the results as a watchlist and add columns, charts, etc and then save the workbook. When you open the workbook it will run the scan and update the list automatically as it is linked to the scan file: