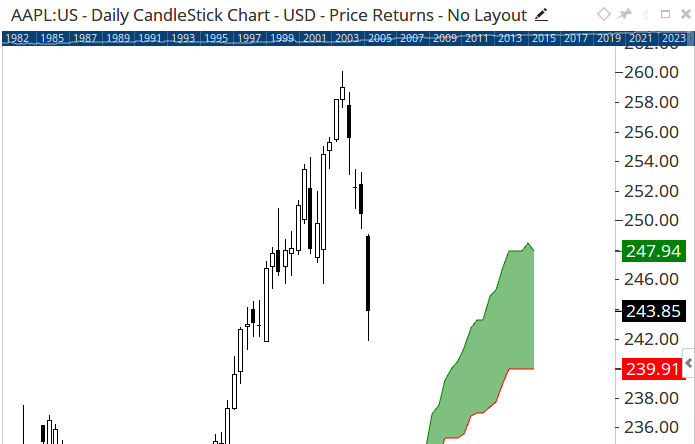
Hello, I am trying to write a script for daily and weekly bar opens and closes above the Ichimoku cloud. I asked the ScripterBot, and this is what I got, which shows no results on the chart. I am not sure if the setting has to be plotted into the script in order to see the result on the showbar option.
Thanks,
Mo
// Calculate Ichimoku Cloud components
IchimokuCloud = ICHIMOKU(); // Get Ichimoku Cloud values
TenkanSen = IchimokuCloud.Tenkan; // Tenkan-sen line
KijunSen = IchimokuCloud.Kijun; // Kijun-sen line
SenkouSpanA = IchimokuCloud.SenkouA; // Senkou Span A
SenkouSpanB = IchimokuCloud.SenkouB; // Senkou Span B

// Check if the daily bar opens and closes above the Ichimoku cloud
OpenAboveCloud = Open() > Max(SenkouSpanA, SenkouSpanB); // Open above the cloud
CloseAboveCloud = Close() > Max(SenkouSpanA, SenkouSpanB); // Close above the cloud

// Combine conditions
DailyBarAboveCloud = OpenAboveCloud and CloseAboveCloud;

// Output the condition
DailyBarAboveCloud;
