Here’s an example of a scan to show which stocks are above - but within 2% - of their rising 50-period moving average, but there has been a recent pullback towards it. In this example the pullback is defined by the direction of the 5 day moving average, i.e. it’s sloping down:
// create variables for the MA values
MA1 = MA(BARS=5, CALC=Close);
MA2 = MA(BARS=50, CALC=Close);
// Create logic formula;
MA1 IsDown and
MA2 IsUp and
CLOSE() > MA2 and
CLOSE() < (MA2 * 1.02)
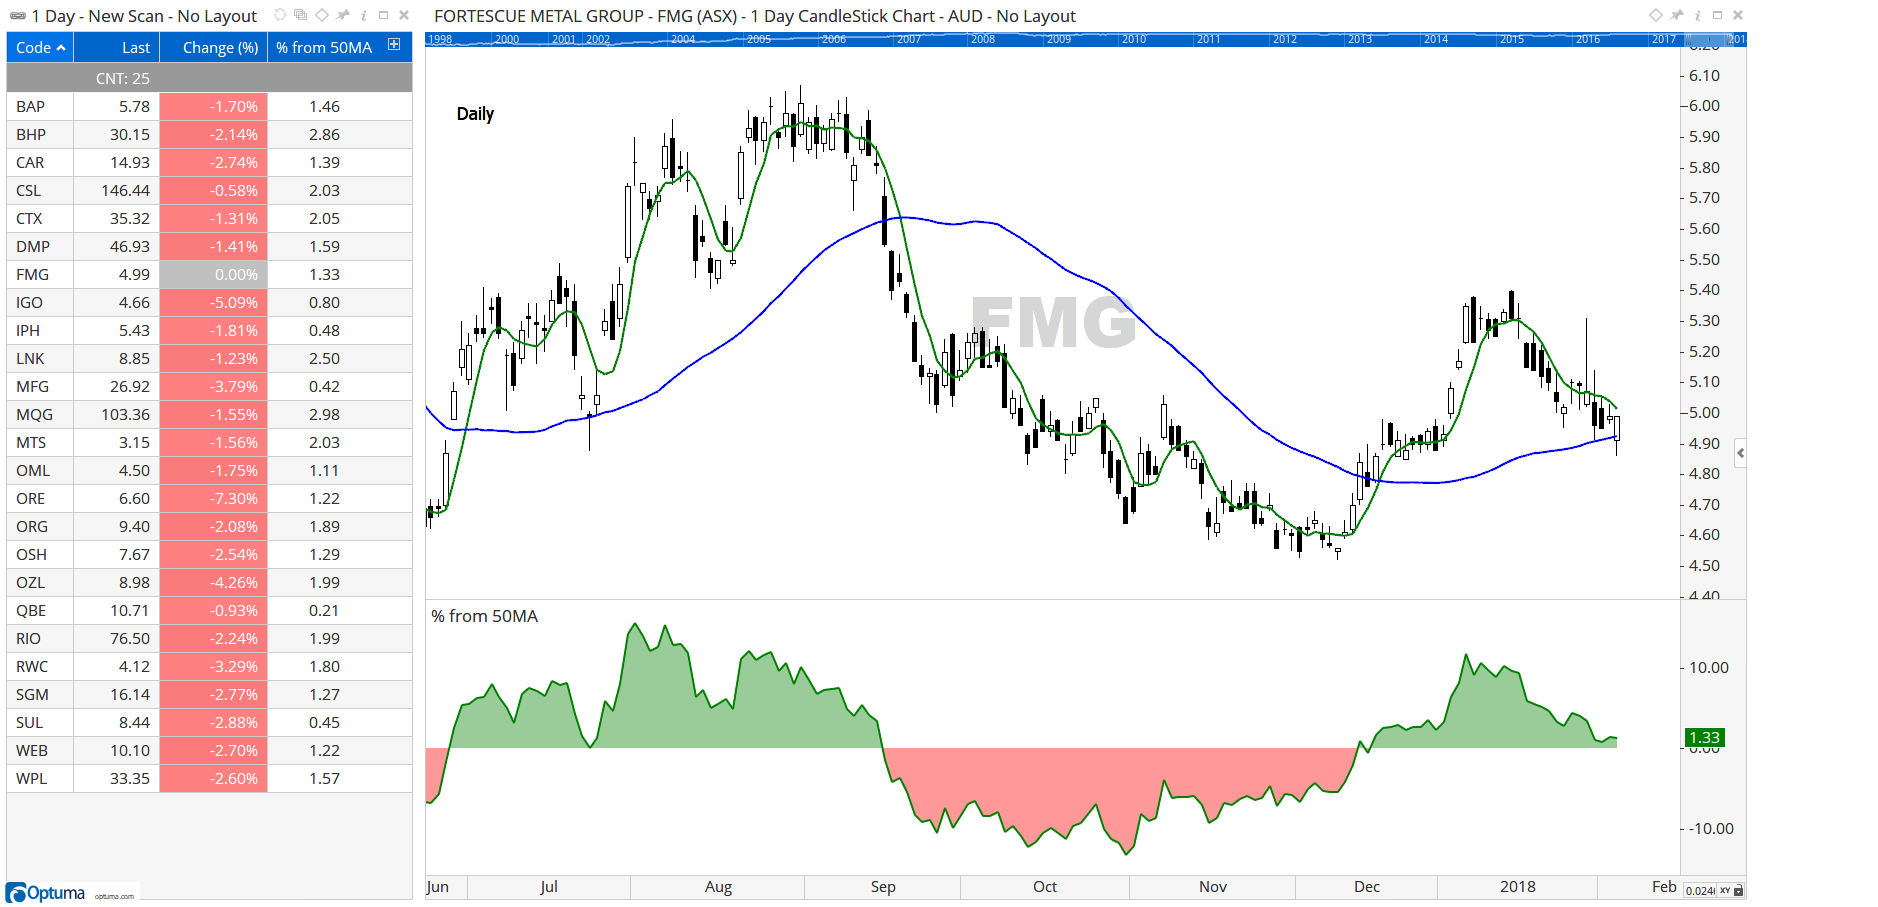
Remember you can open the scan results as a Watchlist and open charts, add additional columns, etc. Then when that workbook is saved and is re-opened the scan will run automatically and the list will be updated. Here’s the current list of the ASX 200 companies that meet the above scan: