Each bar on a chart has a BARDATE() value, which for daily (or weekly, monthly, etc) bars are whole numbers. If using intraday data (eg 60 minutes) then each BarDate value will have a decimal.
This is calculated by dividing the number of minutes of the timestamp of the bar by 1,440 (ie the total number of minutes in 24 hours).
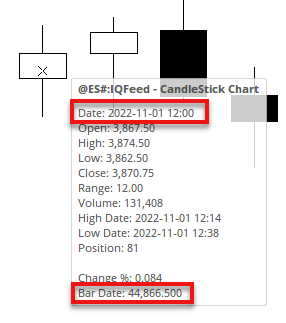
For example, 12 noon would be 12 x 60 = 720/1440 = 0.5, so the noon bar for November 1st 2022 has a BarDate value of 44,866.5:
9:30am = (9 x 60) + 30 / 1440 = 0.395833
4:00pm = 960 / 1440 = 0.666667
These intraday BarDate values can be used in scripting, such as to automatically place a vertical line on 8:30am bars in a Show Bar:
//Find the full bar date with intraday decimals;
V1 = BARDATE();
//Find the daily bar date, without decimals;
V2 = ROUND(V1, DECIMALTYPE=0);
//Reduce bar date to intraday range only;
V3 = V1 - V2;
//Intraday bars have a value of min/1440, so 8:30 would be 510/1440 = 0.35416666667 to be rounded to 6 decimals;
Round(V3, DECIMALTYPE=0.000000) == 0.354167
Here’s an example on a 15 minute chart of the S&P500 emini:
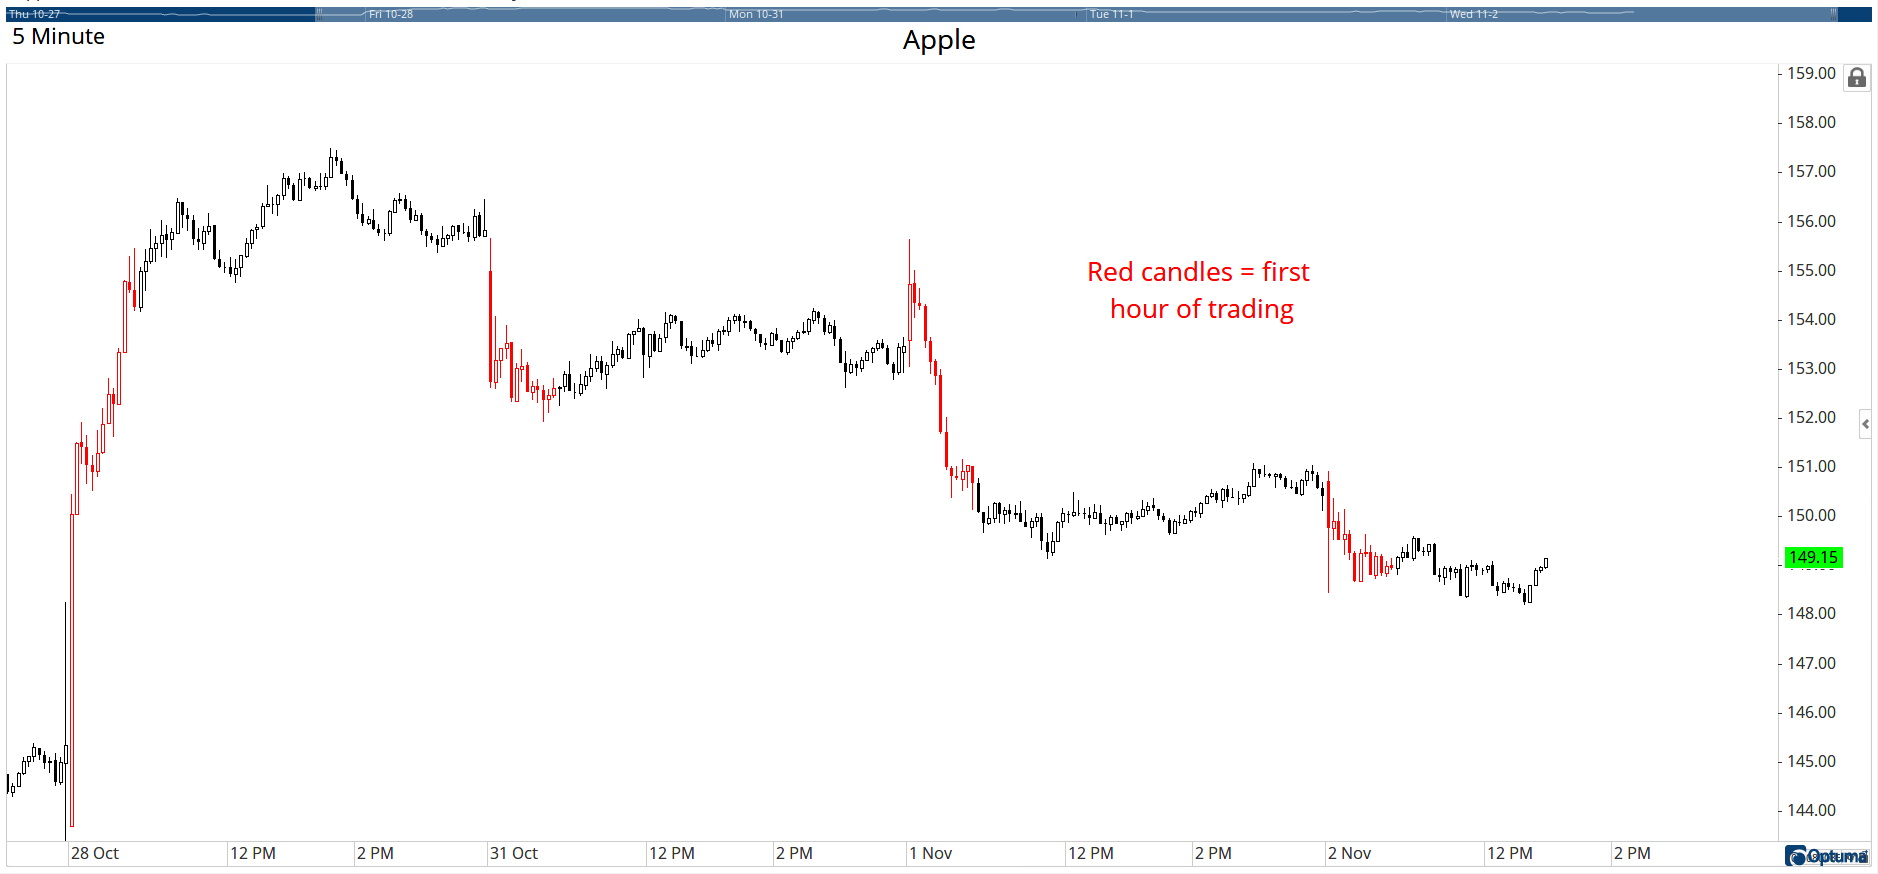
To colour bars for the first hour of trading (9:30am - 10:30am) change the last line of the formula above to the following to be used as a custom colour scheme:
Round(V3, DECIMALTYPE=0.000000) >= 0.395833 and Round(V3, DECIMALTYPE=0.0000) <= 0.4375