Hi, I’m trying to get the MACD Histogram to look like the screenshot below and I have been using the MACD Histogram Color scripts but it is not working.
Can you please provide the 4 color scripts for this, ie dark green, light green, dark red, light red.
Thanks,
Karen
Hi Karen,
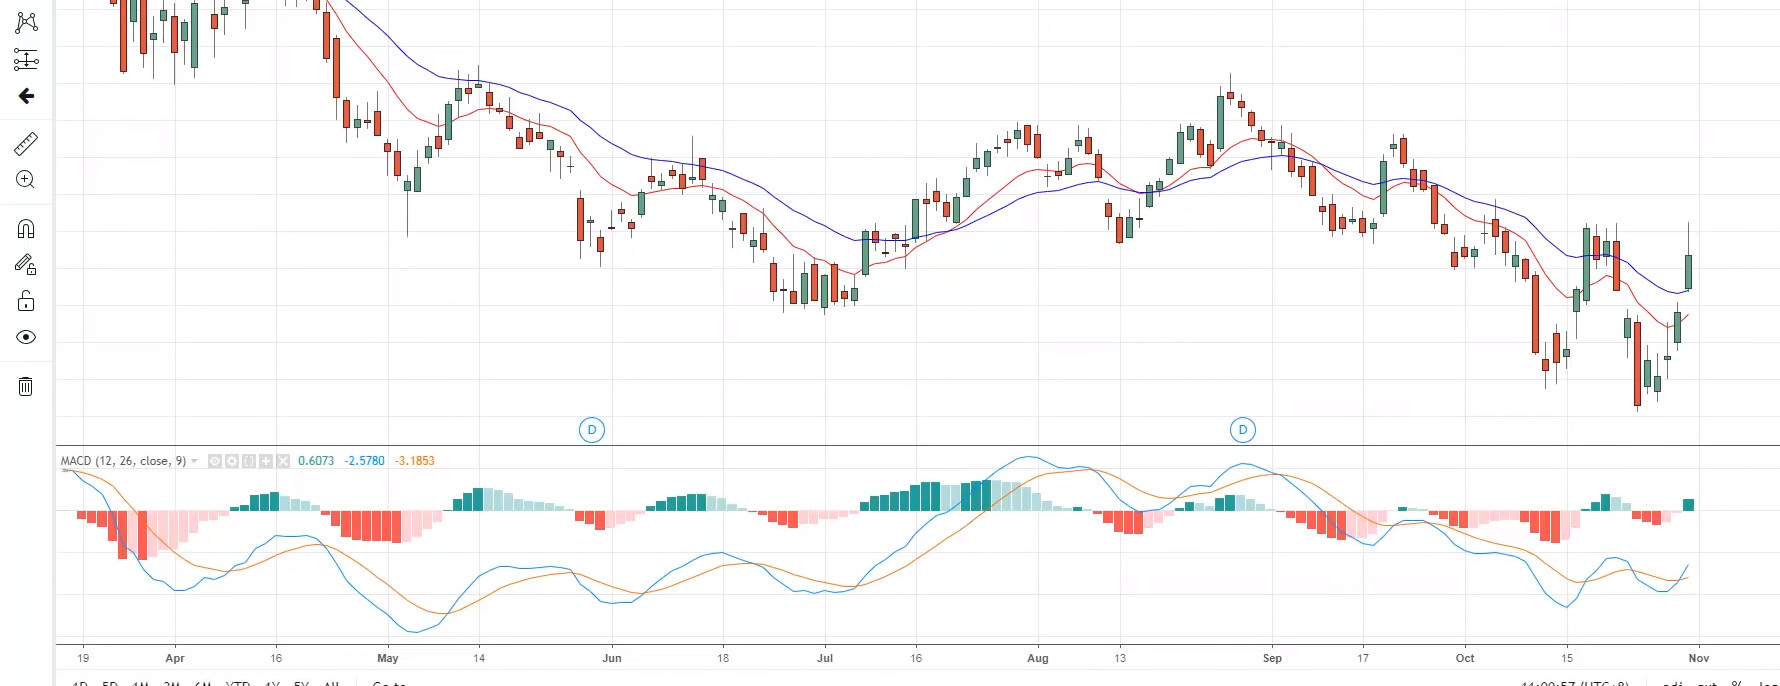
What are the rules for the colours? Looks like it’s dark green above zero and higher than the day before, and lighter green if lower.
For dark green:
//Get MACD Histogram value;
V1 = MACD(BAR1=12, BAR2=26, OSC=9);
V1 > 0 and V1 IsUp
Light green would be V1>0 and V1 IsDown
Dark red would be V1<0 and V1 IsDown and light red IsUp.