Hello,
I am new to Optuma and attempting to create Scanning Manager Script filter that shows a recent minimum move say down just prior to me looking for a long trigger which could be a MACD cross or close cross of say 13EMA.
The Script I have tried is below -
RFE(BACKTYPE=Weeks, BARS=8, , > 20 * (CALCSTYLE=ATRs, CALCBAR=11))
This Script hasn’t worked as expected.
I am looking for a minimum move down of 20 * ATR(11) over the last 8 weeks.
This would possibly include a week or two of PA moving back up B4 the Trigger occurs.
Thanks,
Brad
Hi Brad,
I think the following script will do what you’re after:
RFE(BACKTYPE=Weeks, BARS=8, CALCSTYLE=ATRs, CALCBAR=11) > 20
This is an example of one of the codes found that met the criteria within the last week:

If you are after something different please provide a screen shot example of the chart setup you’re trying to identify with a script and we’ll take a look.
Hi Matthew,
Thanks for your reply.
I have used the Script you provided plus a trigger of a close cross of a MA ie 13EMA or 20SMA for test purposes in the scanning manager.
The example RDH.ax chart you provided shows a nice PA move down and I would be looking to buy soon after on a trigger ie - the 1st close up cross of 13EMA or 20SMA.
APH.ax (attached) has had a nice move down and I would looking to buy 15/4/20 after a close above the 13EMA.
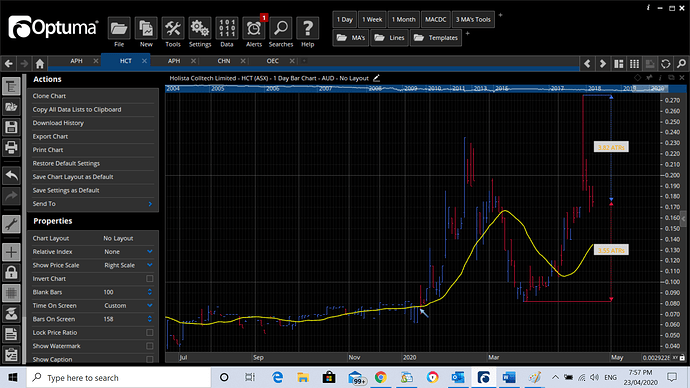
HCT.ax had a 20SMA trigger on 28/1/20, but I wouldn’t be interested in this example as a large PA down move trade as it hasn’t had a prolonged down move. For this reason could the Script you supplied be modified from “CALCSTYLE=ATRs, CALCBAR=11) > 20” to a 40% down move of the close price at the high bar the 40% down move was calculated from? as the just prior very small price bars would possibly effect the ATR calculation.
Please note - If I DLC on a ticker in the scanning manager I get those lines and ATR values which I dont get if I export to a watchlist, but they appear not to be referencing the trade trigger date.
Once the Script appears to be working correctly, I may change the numbers as per requirement.
Please not I would normally have volume and other filters in the script as well, but for now I am just looking at PA.
Thanks Greg.
ATR isn’t the best measure of price movement because it is in $ so isn’t the best when comparing stocks.
There are few ways to find 40% price falls over the last 8 weeks, eg rate of change over the last 40 days (8 weeks) is < -40:
ROC(BARS=40) < -40
Or if you wanted a 40% fall from the 8 week high:
//Get 8 week high
H1 = HIGHESTHIGH(BACKTYPE=Weeks, BARS=8);
//Is it more than 40% away
1-(CLOSE()/H1)>0.4
PS: What do you mean by ‘a nice PA move down’?
Hi Darren,
Thanks for your reply and script ideas.
What I mean by ‘a nice PA move down’ is a somewhat sustained “price action” move down, it can be almost straight down as per the RDH example above or it can show some corrections but it has still moved down by say 40% in the last 8 weeks period.


