Monthly Data on Daily Chart

Hi,

I have come across a specific problem where I am using a custom code with monthly data and displaying this monthly custom code calculation in a daily chart.
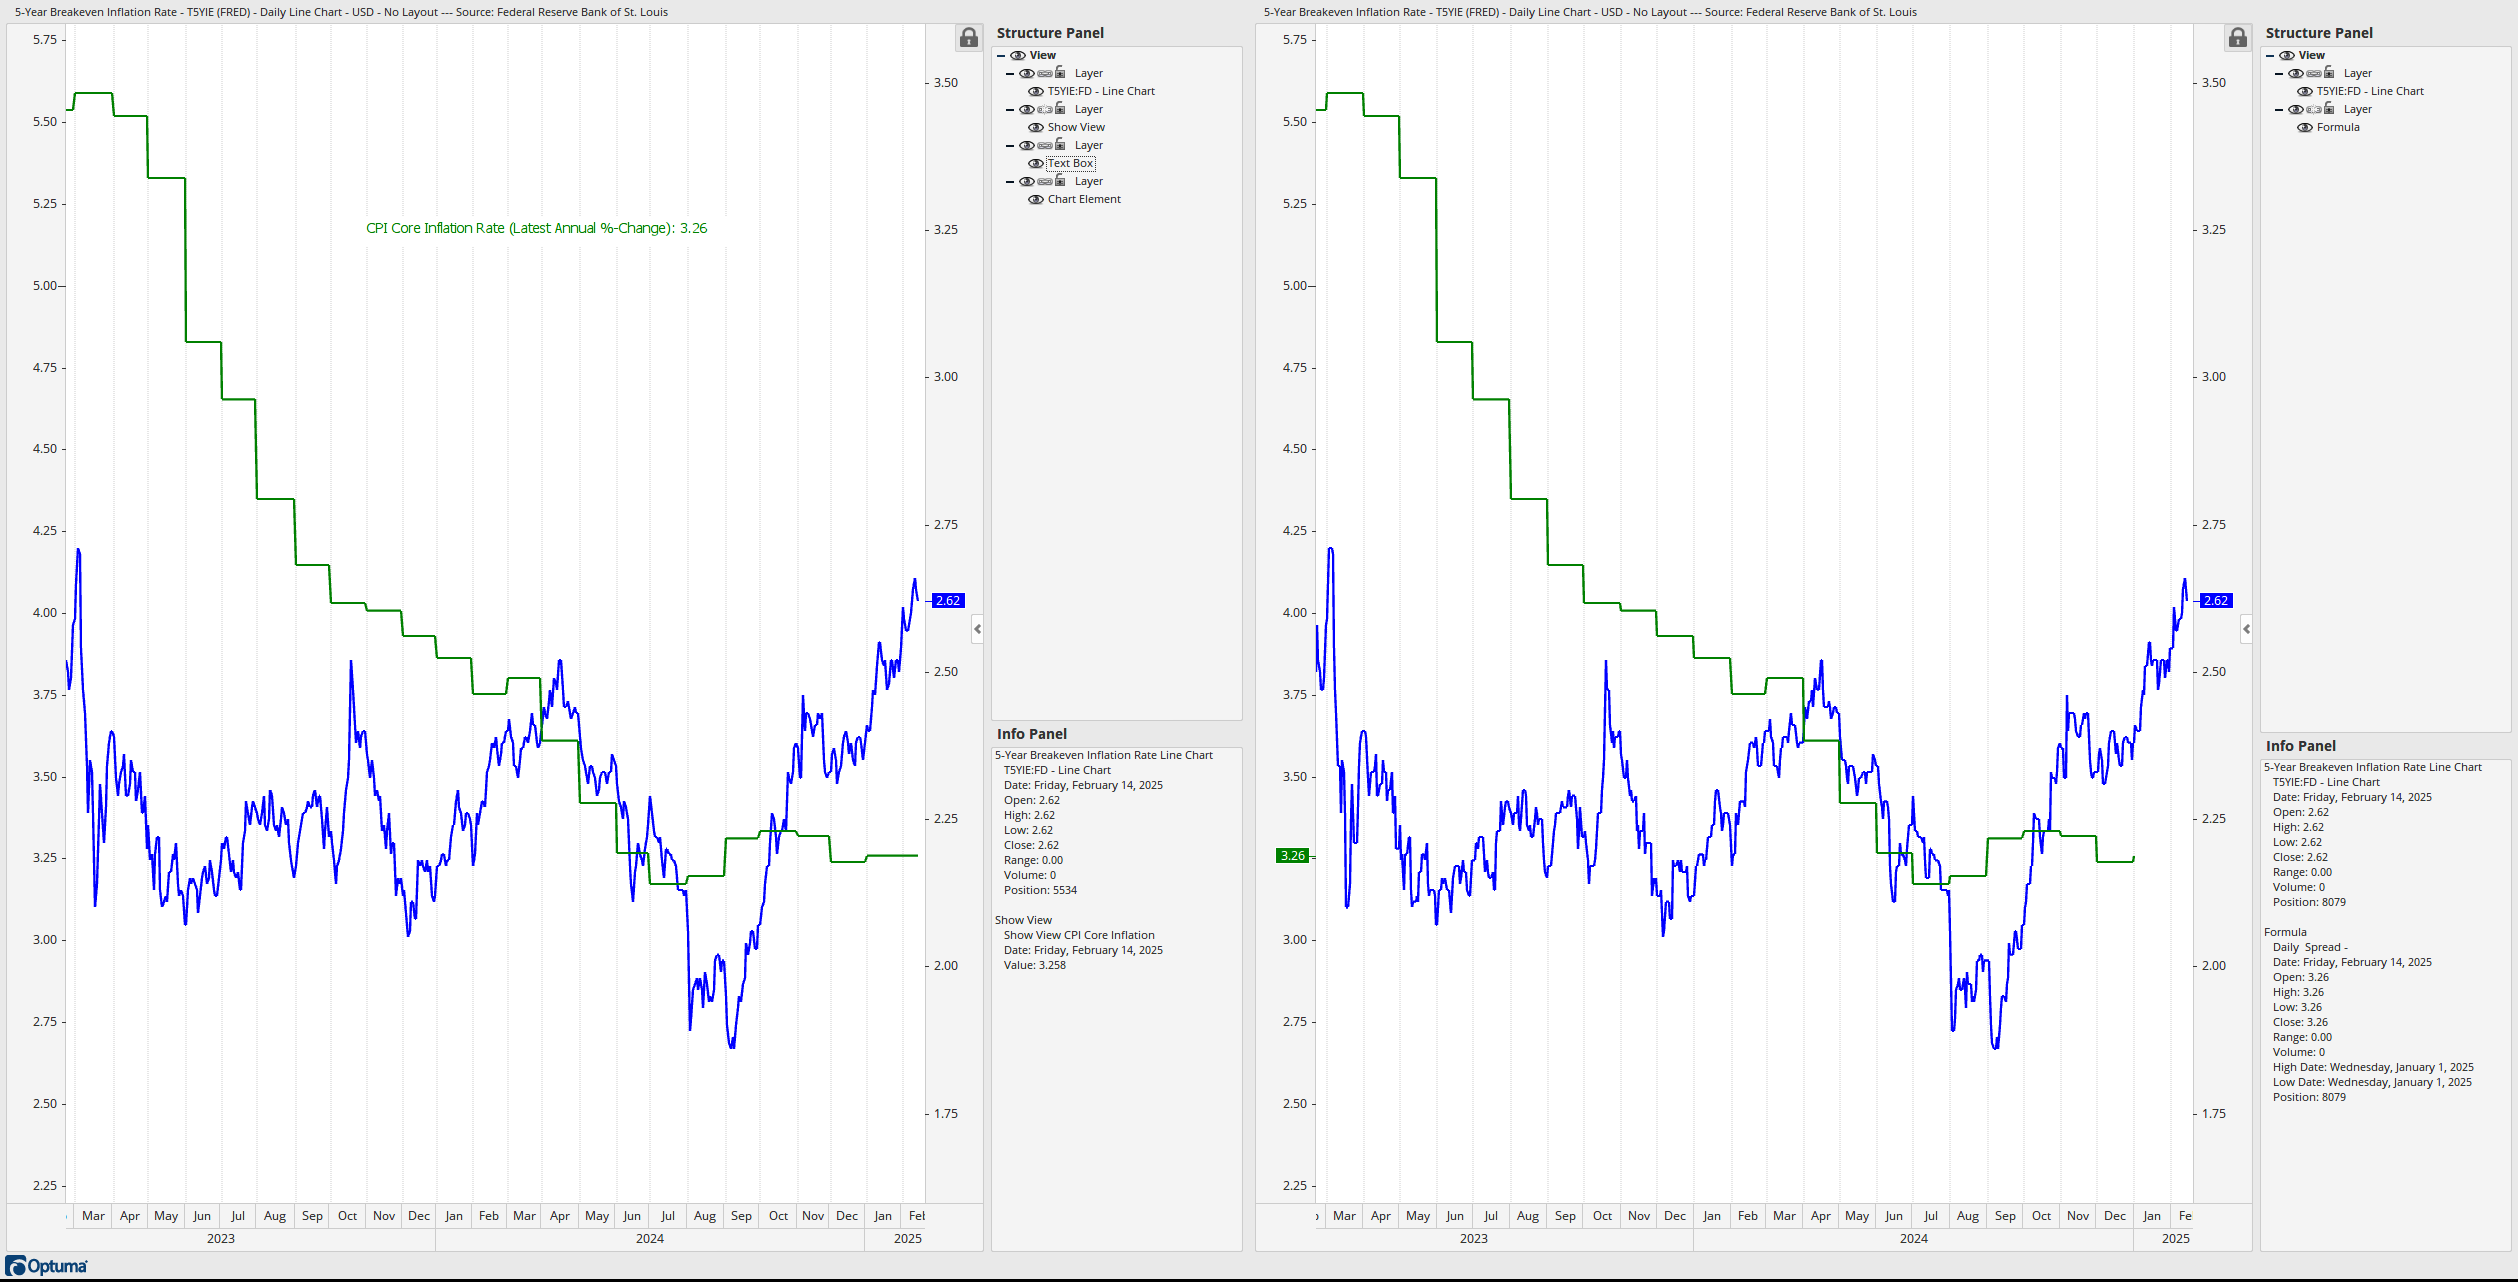
Here is the chart:

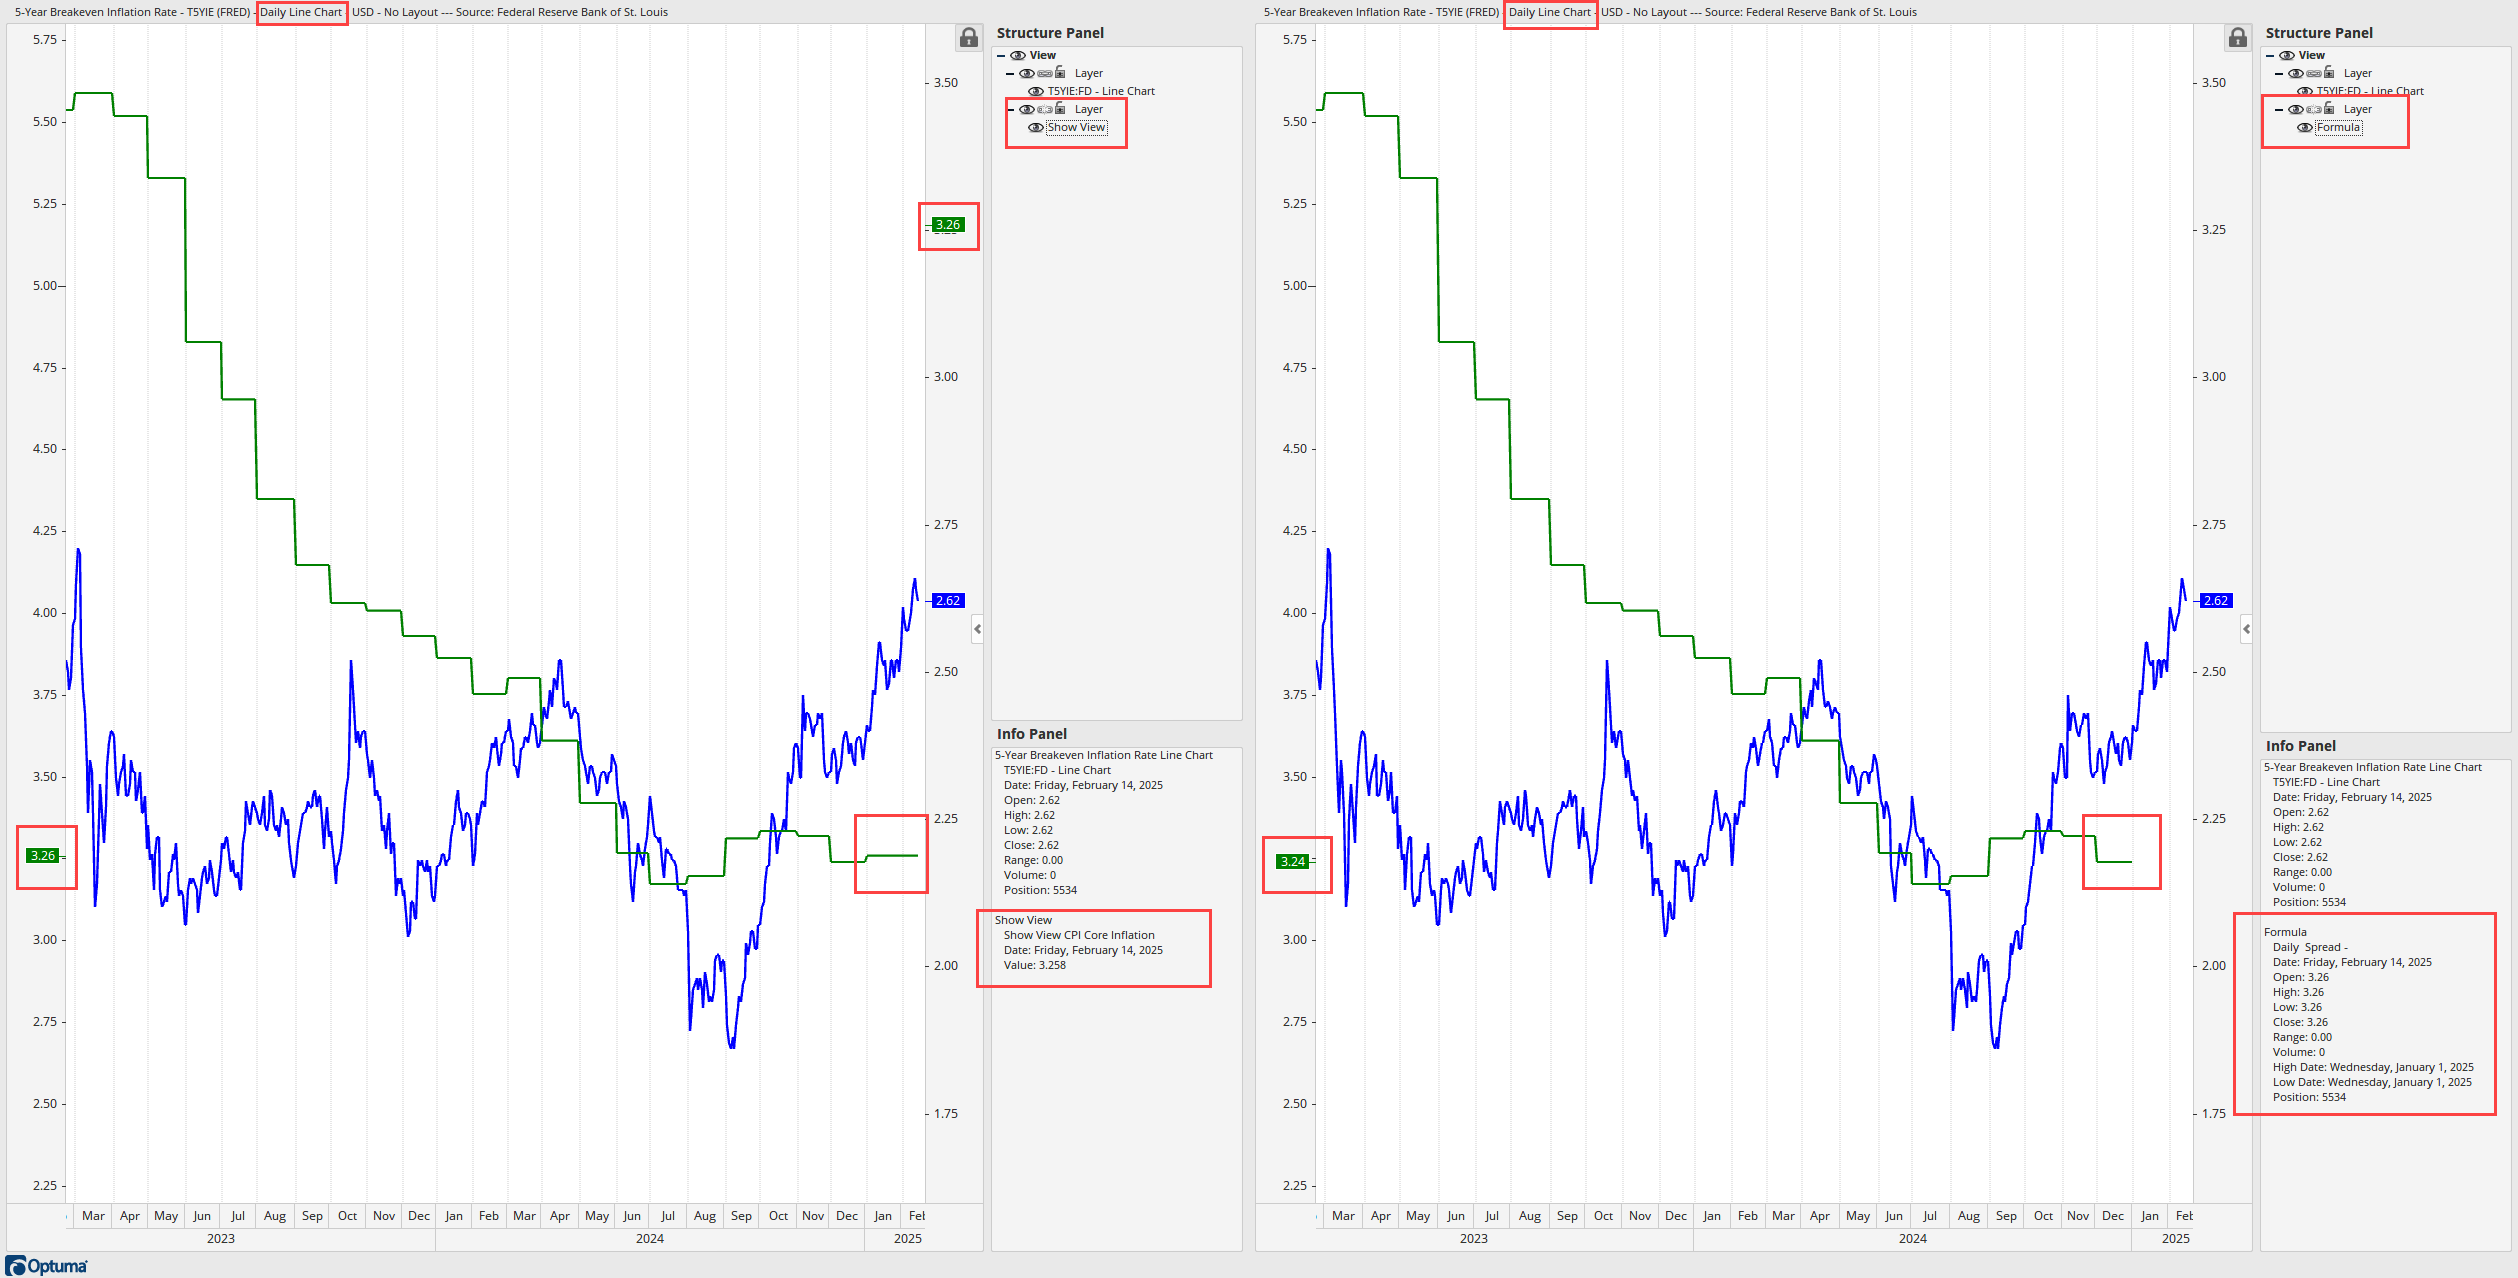
The right chart uses the following custom code script:

// Getting the CPI Core Index Data
Line1 = GETDATA(CODE=CPILFENS:FRED) ;

// Calculating the CPI Core Inflation
Line2 =  (( Line1 / Line1[12] )  -1 )  *  100 ;
Line2

A variation of the script would be:

// Calculating the CPI Core Inflation
 (( CPILFENS:FRED / CPILFENS:FRED[12] )  -1 )  *  100

Both scripts have the same results on the chart.

As you can see on the right chart the last displayed value of the green line is “3.24” although in the Info Panel the actual last value is “3.26”.

The chart on the left uses the same data BUT the green line is displayed using a Show View script.

Here is the Show View script:

// Getting the CPI Core Index Data
Line1 = GETDATA(CODE=CPILFENS:FRED) ;

// Calculating the CPI Core Inflation
Line2 = ((Line1 / Line1[12])  -1 ) * 100 ;
Line2

The left chart using the Show View script displays the last correct value of “3.26”.

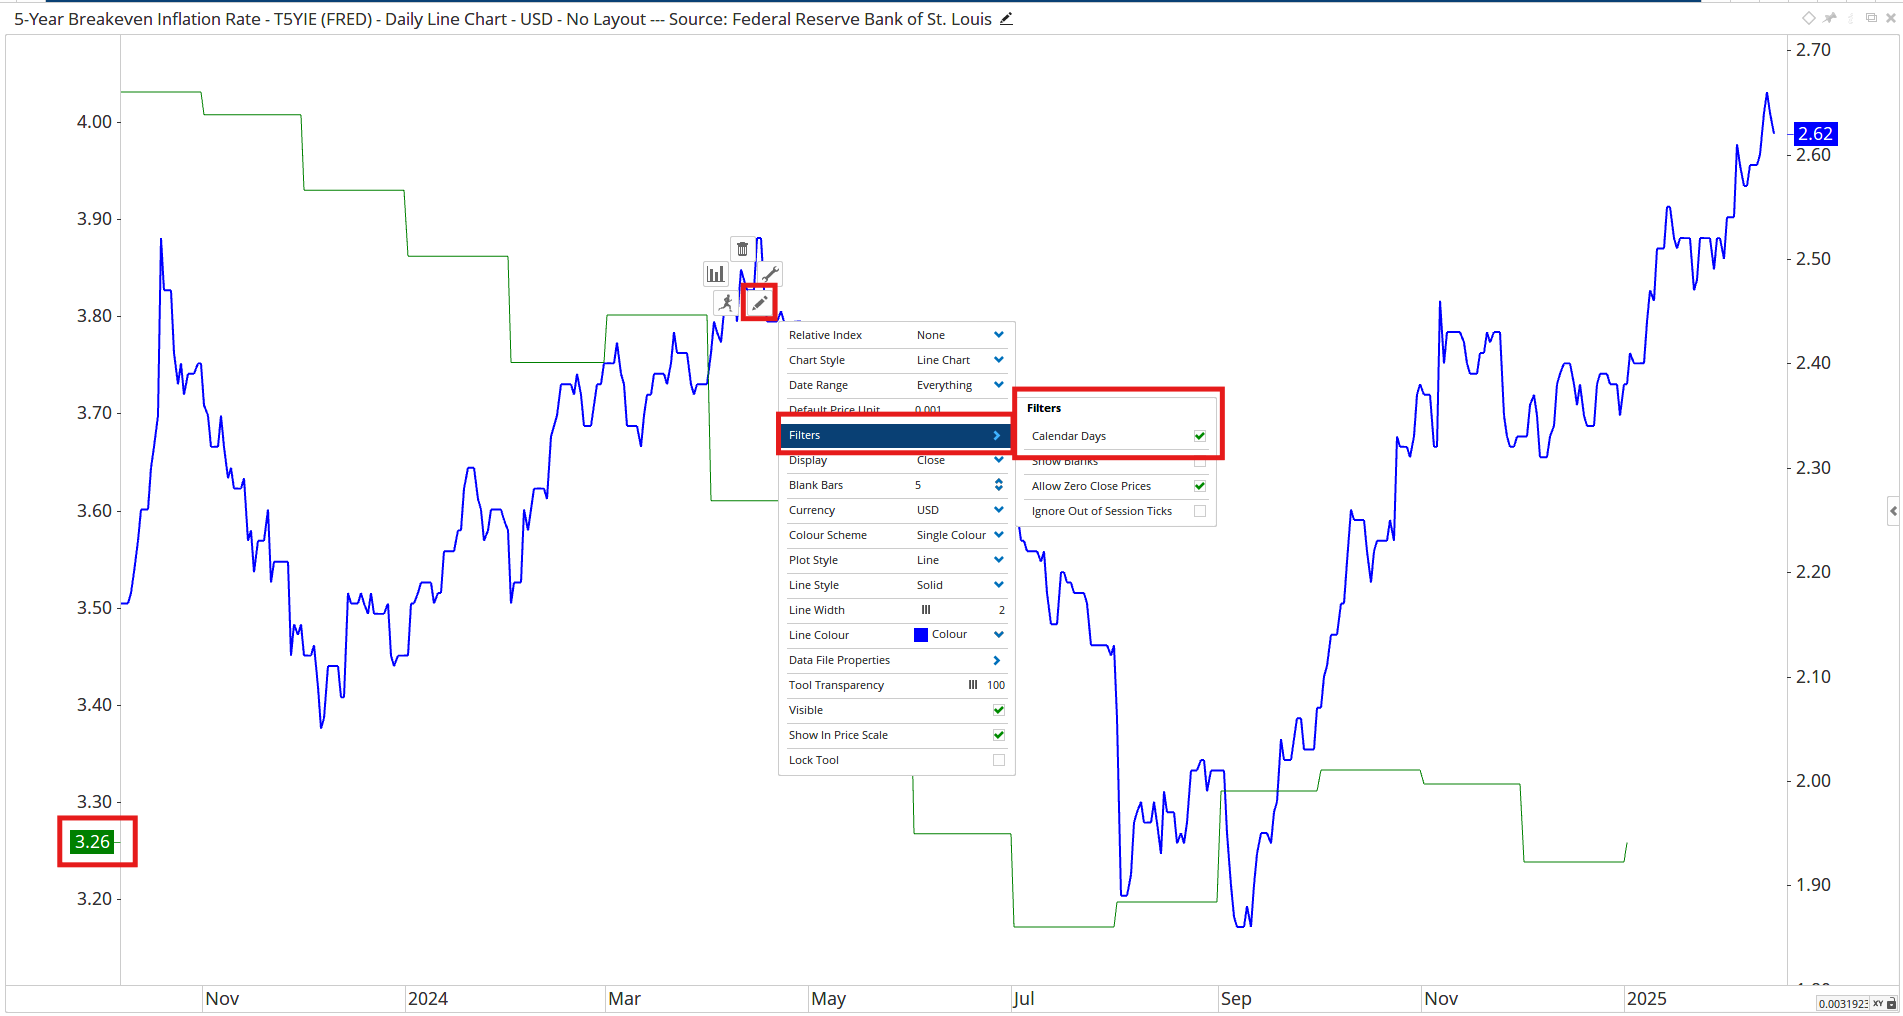
So far so good! BUT when I use the Show View tool with the property “Show in Price Scale” the last price is highlighted on BOTH price scales (left and right price scales)!!! I don’t want that!

There are therefore two ways to solve the problem:

  1. Is it possible to use the Show View script BUT highlighting the last price ONLY on the left price scale?

  2. Is it possible to use the custom code script AND have the last price displayed on the chart?

I have uploaded the workbook for testing.

Thank you all very much.

Thomas

Monthly on Daily Chart.owb (42.5 KB)

Hi Thomas,

Tricky one to work out but it’s because the monthly data is always dated the 1st of the month, and the last monthly CPI data was January, ie January 1st. But there wasn’t any data for T5YIE on New Years Day, so the overlaid 12 month change doesn’t have the bardate to link to, so it reverts to Dec 1st (when the 12 month change was 3.24).

Open a new chart of T5YIE with just the right scale, then overlay the Line2 custom code using the left scale, and it will show 3.24. Then right-click on the T5YIE line and change the Filters property to show Calendar Days. This will add Jan 1st to the chart, and the overlaid line will then show the correct 3.26 value in the left scale.

(Note this issue will occur whenever the 1st of the month falls on a non-trading day, such as a weekend).

Hi Darren,

Thank you very much for your really tricky solution of the issue and of course your solution works.

But when using the custom code script the green CPI core inflation rate line (right chart) makes only an up move at the beginning of January and the line is not extended to the right end of the chart as it is done using the Show View script (left chart).

However, this is logical, as the January CPI date is 01/01/2025 and therefore the green line cannot be extended to the right end of the chart.

For this reason, I opted for the Show View script option (left chart), as the green line, which extends to the right end of the chart, makes the differences between the two lines more visible.

I have also decided to disable for the green line, which uses the left scale, the property "Show in Price Scale” to avoid displaying the latest value on the right and left scale.

To nevertheless display the last value of the green line I use the Chart Element tool with a text box as background.

The script for the Chart Element tool is the following:

Script Name: CPI Core Inflation Rate (Latest Annual %-Change)

// Getting the CPI Core Index Data
Line1 = GETDATA(CODE=CPILFENS:FRED) ;

// Calculating the CPI Core Inflation
Line2 = ((Line1 / Line1[12])  -1 ) * 100 ;
Line3 = LAST(Line2) ;
Line3

Here is the chart:

BEST SOLUTION (new feature request):

When using the property "Show in Price Scale” with a Show View script the last value of a data series that uses the left scale should ONLY be highlighted/marked on the left scale and a data series that uses the right scale the last value of the data series should ONLY be highlighted/marked on the right scale.

I have a few other charts (whether daily, weekly or monthly data) with the same “Show in Price Scale” issue when using a Show View script, i.e. that the last value of a data series is highlighted/marked on BOTH price scales, even though one data series uses the left scale and the other data series uses the right scale. This can cause a lot of confusion!

Thanks,
Thomas

Hi Thomas,

The only way to do this would be to overlay the custom code on the left scale, and show in price scale. The 2 scales are independent of each other so you can put your cursor in each scale and roll your mouse wheel to adjust:

Hi Darren,

Really many thanks for your efforts.

I know the solution you are offering in your above post.

As mentioned in my post before, I opted for the Show View script option (left chart), because the green line extending to the right end of the chart makes the differences between the two lines more visible.

Here is my final chart solution I prefer:

BUT as also mentioned in my earlier post, the best solution would be the one I have described under “BEST SOLUTION (new feature request)”.

Thanks,
Thomas