Hi,
I’m having difficulty coding this. I am trying to place a show bar over each bar which is a new 365 day high using the following script:
//This is a 365 day new high indicator
V1=HighestHigh(Day(PERIODAMOUNT=1), BARS=365,BACKTYPE=Days, INCBAR=False, INSIDEBAR=False);
V3=High(Day(PERIODAMOUNT=1))>V1;
V3
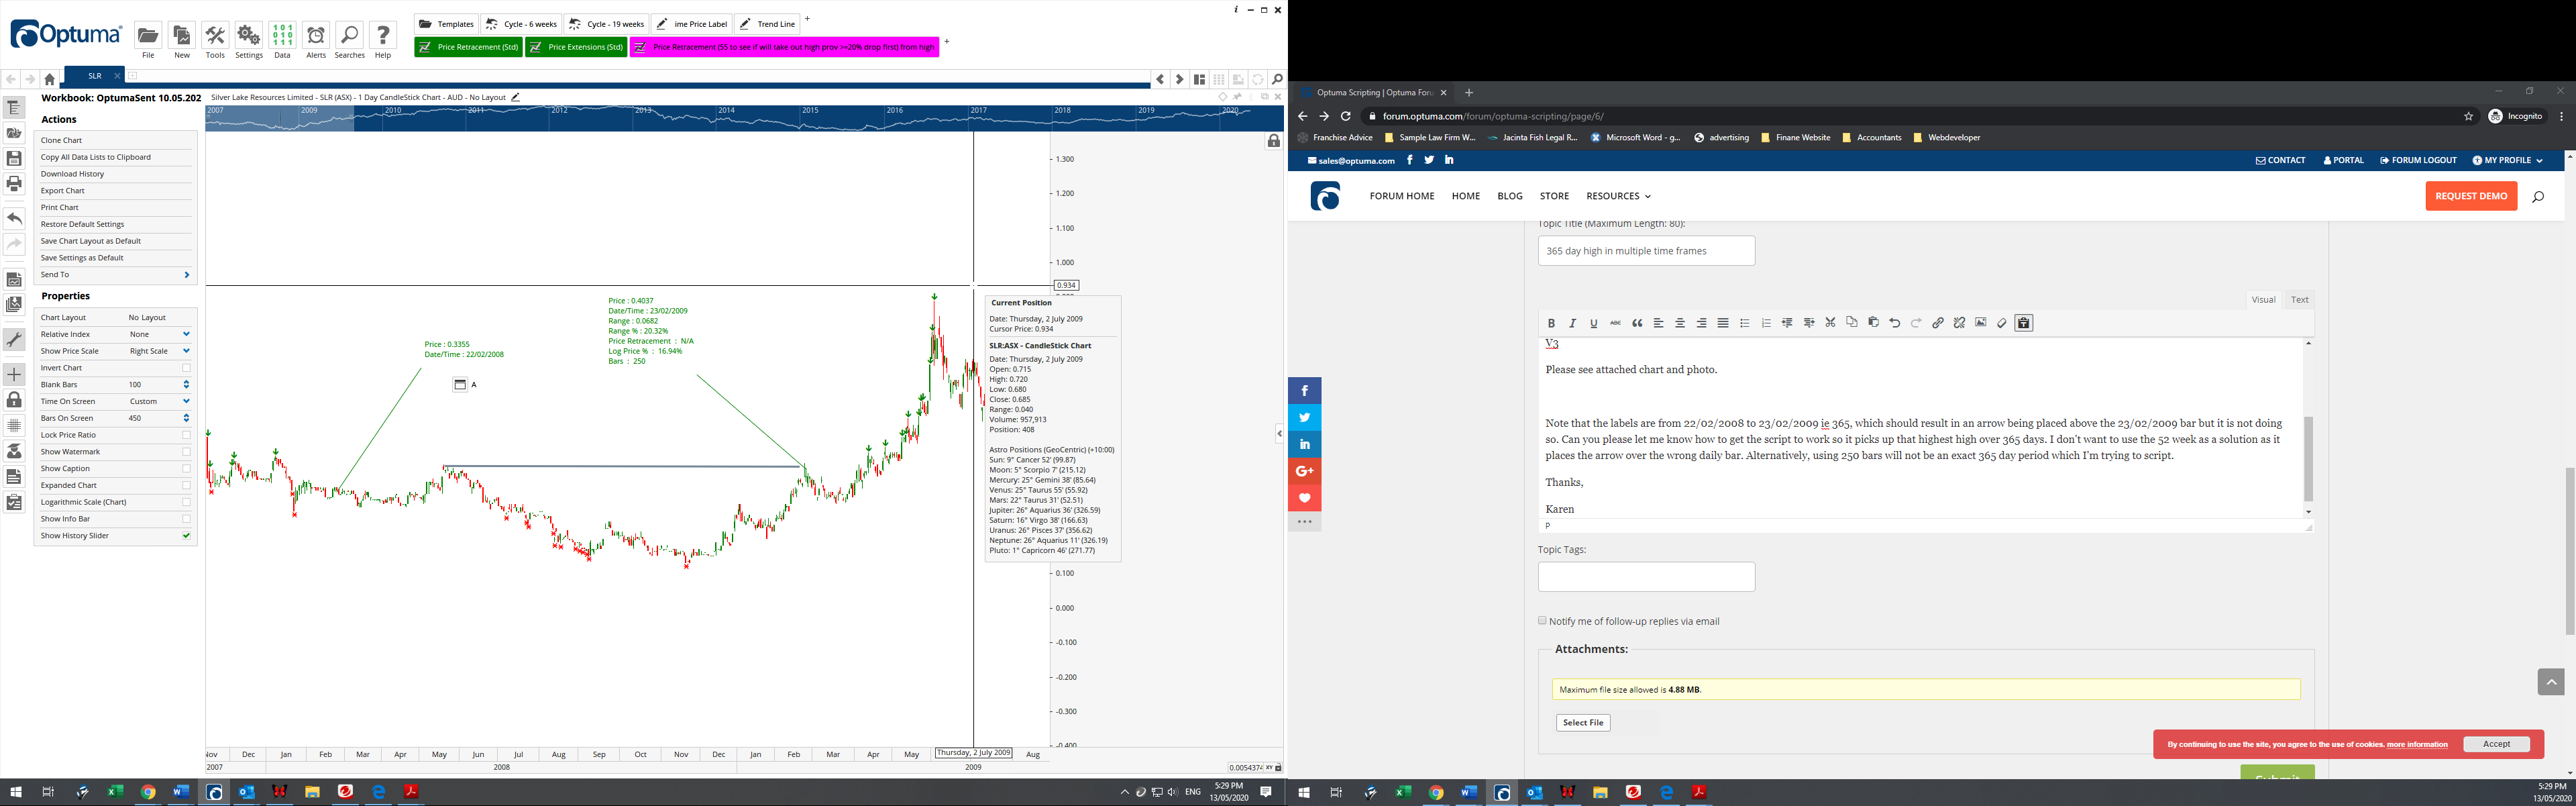
Please see attached chart and photo.
Note that the labels are from 22/02/2008 to 23/02/2009 ie 365 days, which should result in an arrow being placed above the 23/02/2009 bar but it is not doing so. Can you please let me know how to get the script to work so it picks up that highest high over 365 days. I don’t want to use the 52 week as a solution as it places the arrow over the wrong daily bar. Alternatively, using 250 bars will not be an exact 365 day period which I’m trying to script.
Thanks,
Karen
OptumaSent-13.05.2020.owb (20.6 KB)