Hi,
One short question: “Is in Optuma the Excel function “NORMSDIST” available?”
For example: NORMSDIST(-0.5333-(0.633*A1)).
The values -0.5333 and -0.633 are constants.
Thanks,
Thomas
Hi,
One short question: “Is in Optuma the Excel function “NORMSDIST” available?”
For example: NORMSDIST(-0.5333-(0.633*A1)).
The values -0.5333 and -0.633 are constants.
Thanks,
Thomas
Hi Thomas,
No, we don’t have that. I’m curious as to how you would use that in Optuma. Do you see it having value as a time series data set?
All the best
Mathew
Hi Mathew,
thanks for your replay. The reason why I am interested in this function is an article from the Fed of New York about how to calculate the probability of a recession. See page three in “The Yield Curve as a Leading Indicator: Some Practical Issues”.
Here are the links:
…The Yield Curve as a Leading Indicator - FEDERAL RESERVE BANK of NEW YORK
…The Yield Curve as a Leading Indicator: Some Practical Issues - FEDERAL RESERVE BANK of NEW YORK
At the moment I make the calculations in Excel and create a csv file to display the data in Optuma. I have no problem with that but thought perhaps it is possible to do the calculations directly in Optuma.
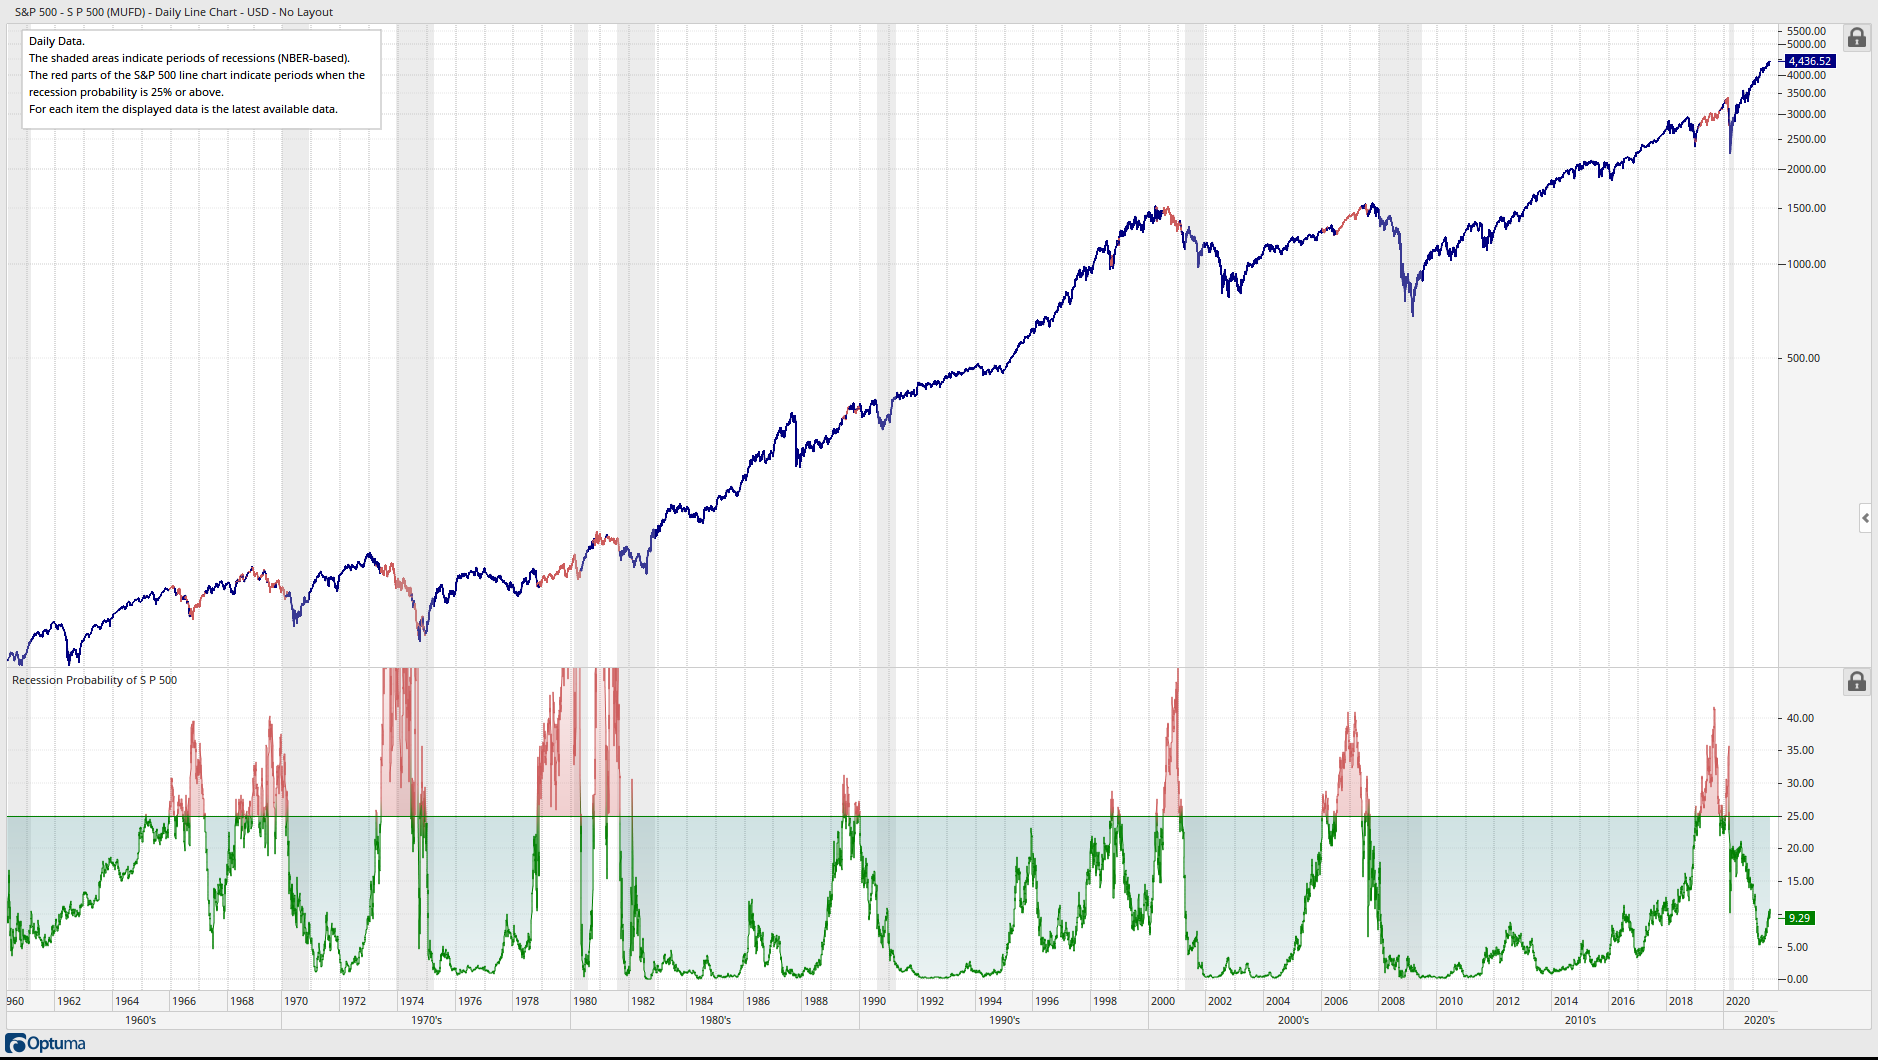
Here is a chart about how I use the recession probability:
Best wishes,
Thomas
The-Yield-Curve-as-a-Leading-Indicator-Some-Practical-Issues.pdf (403 KB)
Probability-of-U.S.-Recession-Charts.pdf (34.7 KB)
Hi Thomas,
I’ll have a read and see what we can do for Optuma 2.1.
In the mean time have you seen this https://twitter.com/mathewverdouw/status/1322400468530683906
All the best
Mathew
Hi Thomas,
I’m reviewing my notes and I had a link to this post to come back to.
Given this function, we have one value for each value of X
function NormDist(X, Mean, StandardDev : Single; Cumulative : Boolean) : Single;
The intention is to add this as a scripting function (not an indicator added to a chart).
Does that meet what you were looking for?
Further to this, how are the values Mean and StdDev in the NormDist function calculated?
I see in your Excel that they are constants but how were they generated? No need to answer if that is a proprietary process.
Hi Mathew,
Thank you for your reply to this old post.
Regarding the calculation of the constants in my Excel spreadsheet, I get these constants from the Fed of New York. I do not calculate these constants.
The Fed of New York published an article in July 2006 entitled: “The Yield Curve as a Leading Indicator: Some Practical Issues”.
In this article, the formulas and constants are published on page 3.
Here is the link to this article:
See under: References → The Yield Curve as a Leading Indicator: Some Practical Issues
The constants have changed since publication in 2006. The current constants can be found at the following link:
See under: Download the monthly data and charts → Probability of a US Recession (Charts)
Regarding your intention to add a NormDist() function: Is it possible to enter just the constants without having to calculate them?
OK, calculating the mean and standard deviation from the spread between the yield on the 10-year T-Note and the 3-month T-Bill is not a big deal in Optuma. BUT the option to add the Fed of New York constants would give exactly the same results as published by the Fed of New York.
I have added the 2006 Fed of New York publication and the current “Probability of U.S. Recession Charts” with the current constants at the bottom of the page.
If you have any further questions, please let me know.
Best wishes,
Thomas
Prob_Rec.pdf (36.2 KB)
The-Yield-Curve-as-a-Leading-Indicator-Some-Practical-Issues.pdf (403.0 KB)
Thanks for that.
The reason I ask is that whenever we add anything to Optuma I want to make sure that we are making it as flexible as possible but also as practical as possible. Having those value as options is fine.
This came up in my notes because I am looking into alternatives to the Normal Distribution assumption for hypothesis testing.
This book has just arrived on my desk and it looks like I have some reading to do
I came across this post too late for it to make the 2.3 update but I’ll add it to the schedule for 2.4.