Hi,
I have the 11 S&P 500 sectors in a watchlist. I also have a column showing a result of a relative strength formula. I want to take the 11 results and normalize them using a stochastic calculation. What is the best way to do this?
thank you
Hi,
I have the 11 S&P 500 sectors in a watchlist. I also have a column showing a result of a relative strength formula. I want to take the 11 results and normalize them using a stochastic calculation. What is the best way to do this?
thank you
Hi Louis,
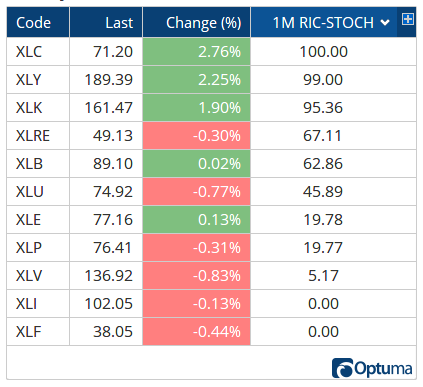
Take the results and nest them in the stochastic function STOCH(), and change the %K value for the lookback period. Here’s the results for the last 22 days using the relative performance RIC.
R1=RIC();
C1=CLOSE(R1);
STOCH(C1, BAR1=22, DEFAULT=%K)
$XLC is at its highest relative level over the last month, with $XLY at 99% and $XLK 95%. Both $XLI and $XLF are at their lowest relative levels: