From time to time my P&F chart overlying the daily/weekly price chart seems to stop in the past at verying time gaps.
For instance, a perfectly formed daily price chart up until today will have a P&F chart that seems to stop years ago (I am looking at one for EL8 that stopped in 2010).
I would like to understand the reason for this and to correct it if possible. A P&F chart is central to my trading method.
Hi Bill,
I’m not sure how the P&F chart is being overlaid on a price chart as they are calculated very differently.
If you can send a copy of your workbook to [email protected] we’ll take a look. Your workbooks are saved here:
Documents/Optuma/Local/Workbooks
Hi Darren,
It is a while since my last post because I was working to solve that problem. It was due to a problem with box size, which corrects when box size is altered appropriately. The P&F chart was never an overlay. It was a separate chart on a page layout.
I have been trying to use PFSCAN to filter instruments based on my assumption that a good time to start looking for trades is when the P&F chart changes direction on a vertical count (it is a filter not an indicator for entry or exit). In reality I have found this to be a very powerful start, which is why I am persisting with the difficulties.
However, I have a range of problems and I think most of them are all about the settings.
- I solved the problem of P&F data disappearing years ago (as above).
- It seems that the best configuration for me is the “Modern” or maybe the “Classic” configuration.
- Box size is a real pain because it really needs to be specific for each instrument over a varying range of asset prices in a watchlist, difficult I think.
- Despite utilising the “Save settings as default” my P&F settings do not seem to be saved for the next P&F chart in the workbook, even after I have saved the Page layout setup. Frustrating. Optuma keeps reverting to the “Custom” setting.
Questions:
- I would like to reset the default settings I apply for a P&F chart. I don’t seem to be able to do this even when I follow what seems to be a logical sequence.
- I would like to do this for the P&F setup being used for the scan (PFSCAN).
- I would like to be able to save these settings to my page layout, which has 3 charts (candlestick, GMMAs, P&F)
- I would like to know the reversal criteria being used for PFSCAN (which I believe scans for a reversal of red/green on the chart)
- Is it possible to insert more flexibility into an automatically adjusted box size based on price?
I know that’s all a fair bit to deal with. Sorry about that. I am so close to having the system I desire and this is all that is standing in the way.
Cheers,
Bill
Hi Bill,
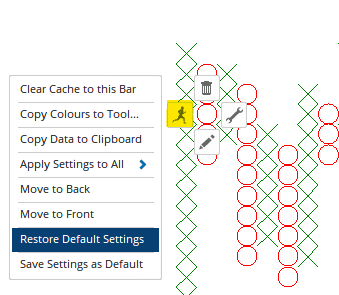
If you click on the P&F chart you can then select Restore Default Settings under Actions:
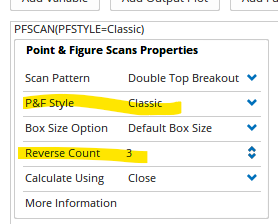
The PFSCAN() uses the default setting automatically, so you can use PFSCAN(PFSTYLE=Classic) instead. The Reverse Count in the PFSCAN() function is 3:
With the exception of the box size (which is different for each chart and determined by the price scale) you can save the P&F defaults as a Page Layout and apply to any symbol, and then change the required box size manually for each one. Because of this the P&Fs won’t work with watchlists because as you scroll done the box size will change, so yuo will need a separate tab for each chart. Hope that helps.
Hi Darren,
I have been thinking about this a lot because I find the P&F so useful. Your suggestions have indeed been helpful, thank you.
I have consulted the bot extensively, but it only goes so far.
I am completely bamboozled about how the box size settings for P&F charts are managed.
We have:
- the mode e.g Classic, Custom, Modern, etc.
- Box size
- Reverse count
Currently when I open individual P&F charts the default settings seem to be set to: custom, reverse count 3, and the box size seems to be correctly individuated to price at about 0.01 (price 3.0, box size 0.03). Obviously it does a calculation to achieve this every time, great. No problems there. Nothing left to do, it’s fine.
But here’s my problem. I have a basic layout with 3 separate charts viz: candlestick, CS plus GMMAs, and P&F.
I often open a workbook layout with several instruments ranged across the top (not watchlist) in that format. The P&F default setting of custom, R3, does not seem to do the calculation to give the correct box size any more (the box size is 0.1 every time). And so I have to individually apply appropriate box sizes for price on every chart. This is a lot of work that I don’t want to do.
Can you tell me why that is so, and also tell me if I am stuck with it at the moment, or whether there is something I can do to save all the work. It seems to me that the box size calculation occurs automatically whenever I open an individual chart, but as soon as I put it in a layout it doesn’t.
Hi Bill,
I think the issue is that the P&F box sizes were not considered when Chart Layouts were designed. As such, the only way to save your preferred box size is to create your charts in their own page tab once it has been created, and not use a Chart Layout or watchlist.