Hi all
I have a tricky issue that I am struggling to find a way around, hoping someone can point me in the right direction.
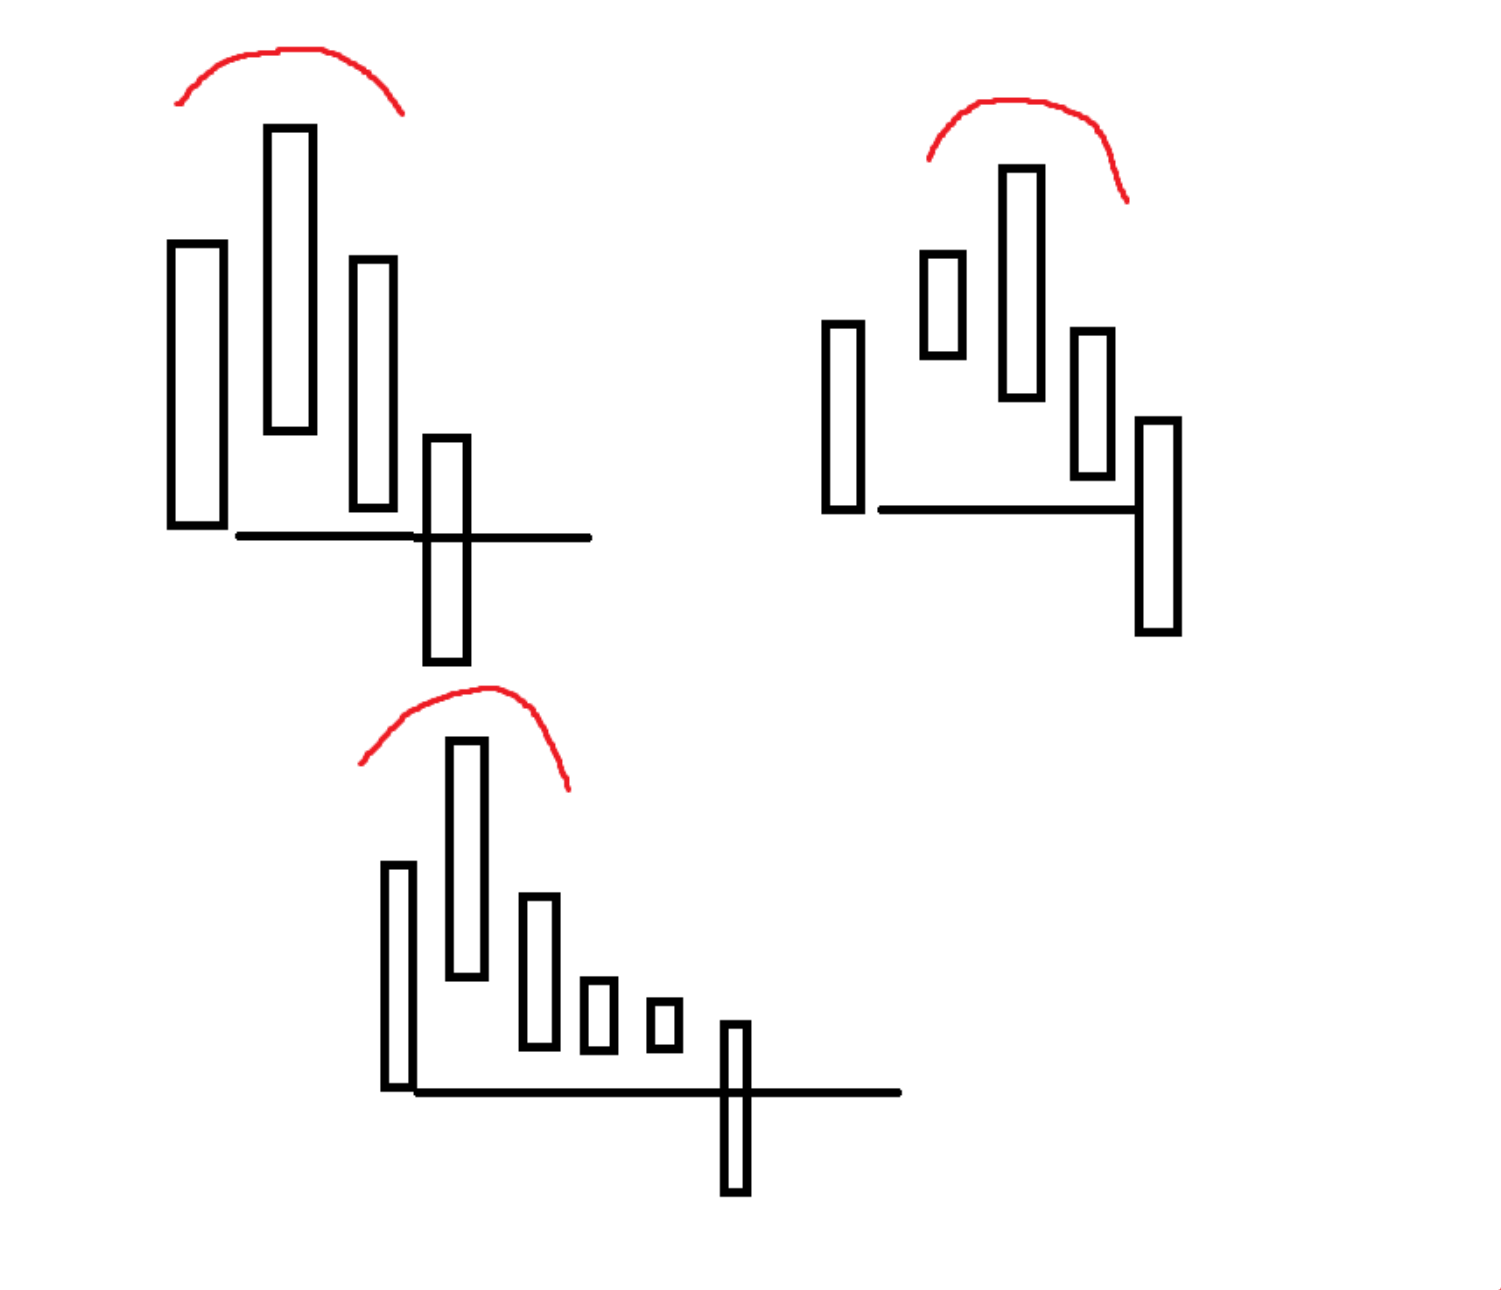
I would like to have a show plot identify the ‘most recent’ low that occurs before a 3-bar ‘pivot’ high. The value that I am trying to identify must also be less than the low of the highest bar in the ‘pivot’ pattern. I have drawn a terrible diagram that hopefully explains what I’m trying to do. Worth noting, I don’t mean the Pivot labels tool (to my knowledge this finds slightly larger patterns that what I’m doing here).
This script was the best I could do, and it works as long as we get a ‘perfect’ pivot. However, the trailing nature of the LowestLow tool means that occasionally it moves on prematurely if there are additional bars within the pattern. Setting it to insidebar=false helps a little with this but not entirely. So I guess I need some kind of condition so that it ratchets up to the significant low and stays there until the next pivot high forms.
//define pivot high
x1 = HIGH() > HIGH(OFFSET=1) and HIGH() > HIGH(OFFSET=-1);
//find candle lows
y1 = LOWESTLOW(BARS=1, INSIDEBAR=False, INCBAR=False);
//find the final low prior to the pivot
plot1 = VALUEWHEN(y1, x1);
Any suggestions hugely appreciated
Jonathan