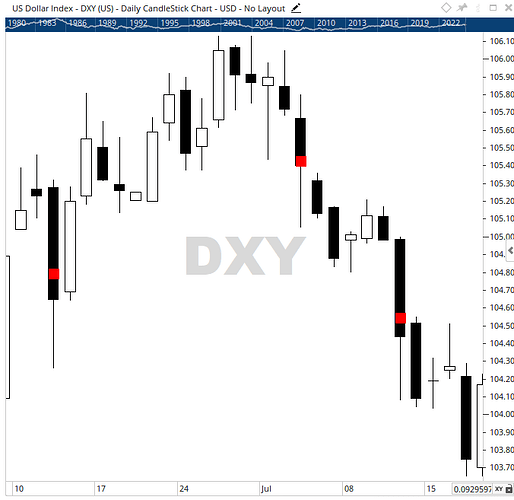
I want a script to show the midpoint of a wide-range candle. So when a candle occurs with the widest range of the past nine bars calculated from the candle’s high and low, a marker will show at the midpoint of that candle’s body to identify it and also to act sometimes as support or resistance.
I know how to write the formula to show which bar has the highest range; I just don’t know how I would plot the marker.
Hi,
If you have a script to find the candle already, you could using something like Valuewhen() to find the High / Low of the candle, the use that to calculate the midpoint.
You can then use an IF() to set to show that value on the triggered candle, otherwise use Hidden() to hide the plot.
If you require further assistance please post the script you have already and we can look at what specific adjustments are needed.
V1 = HIGH() - LOW() ;
V2 = HIGHESTHIGH(V1, BARS=13, INCBAR=True);
V1 == V2 and CLOSE() < OPEN()
This is what I have to identify a down bar that meets the criteria. I’m not sure how to use “Valuewhen()” and “IF” and “Hidden.”
Also, if using Script tool “Show Bar”, how do you get around the built-in Positioning of the marker, where options are High, Low, Top, Bottom, Floating?
Hi,
You would not use Show Bar, you would use Show Plot so that the calculated midpoint value could be applied.
//Set Range
V1 = HIGH() - LOW() ;
//Find Highest Range in 13 Bars
V2 = HIGHESTHIGH(V1, BARS=13, INCBAR=True);
//Set Trigger
V3 = V1 == V2 and CLOSE() < OPEN();
//Find High and Low Price for Trigger Bar
V4 = PRICEATSIGNAL(V3, PRICE=High) ;
V5 = PRICEATSIGNAL(V3, PRICE=Low) ;
//Find Trigger Bars Midpoint
V6 = (V4+V5) / 2;
//Show Dot at Midpoint on Trigger Bar, otherwise hide output
V7 = IF(V3 == 1,V6,Hidden()) ;
//Final Plot
V7
I used PriceAtSignal rather than ValueatSignal given it was OHLC we needed. Set the Show Plot to display a Dot plot style. The above script will show a dot at the midpoint of the trigger bars found using your original script.
Note: Due to the way the script works, you’d need to go to Settings > Workspace > Charts and make sure Autoscale includes tools and indicators is unticked.
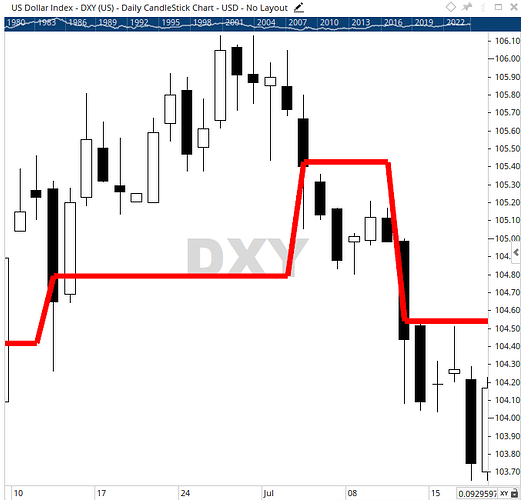
If you want to adjust it to a line between each trigger bar instead, use the following script:
//Set Range
V1 = HIGH() - LOW() ;
//Find Highest Range in 13 Bars
V2 = HIGHESTHIGH(V1, BARS=13, INCBAR=True);
//Set Trigger
V3 = V1 == V2 and CLOSE() < OPEN();
//Find High and Low Price for Trigger Bar
V4 = PRICEATSIGNAL(V3, PRICE=High) ;
V5 = PRICEATSIGNAL(V3, PRICE=Low) ;
//Find Trigger Bars Midpoint
V6 = (V4+V5) / 2;
//Show Dot at Midpoint on Trigger Bar, otherwise hide output
V7 = IF(V3 == 1,V6,Hidden()) ;
//Final Plot
NONZERO(V7)
And set the Show Plot to display a Line rather than a Dot.
1 Like

