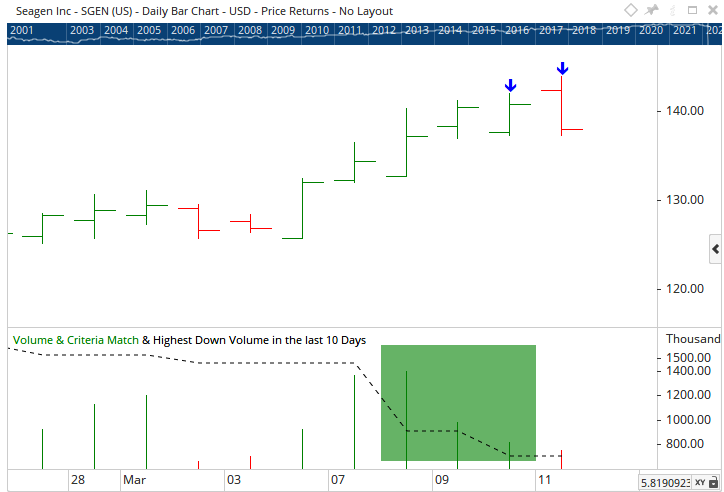
I have made following script to show pocket pivots (current volume should be higher than the highest down volume in the last 10 days) in chart. Next I would like to have scan that finds stocks where have been at least 3 pocket pivots during last 10 trading days. I am wondering how that could be made using this script?
currVol = Volume();
greenDay = Close() > Open();

//make all upday volumes zero
v1 = IF(Close(1) < Open(1), Volume()[1],0);
v2 = IF(Close(2) < Open(2), Volume()[2],0);
v3 = IF(Close(3) < Open(3), Volume()[3],0);
v4 = IF(Close(4) < Open(4), Volume()[4],0);
v5 = IF(Close(5) < Open(5), Volume()[5],0);
v6 = IF(Close(6) < Open(6), Volume()[6],0);
v7 = IF(Close(7) < Open(7), Volume()[7],0);
v8 = IF(Close(8) < Open(8), Volume()[8],0);
v9 = IF(Close(9) < Open(9), Volume()[9],0);
v10= IF(Close(10) < Open(10), Volume()[10],0);

// In pocket pivot current volume should be higher than the highest down volume in the last 10 days
pocketPivot = v1 < currVol and v2 < currVol and v3 < currVol and v4 < currVol and v5 < currVol and v6 < currVol and v7 < currVol and v8 < currVol and v9< currVol and v10 < currVol;

pocketPivot and greenDay