Would it be possible to include Point And Figure Counting to find the future price of a trading range as done for the Wyckoff method?
Attached are two files.
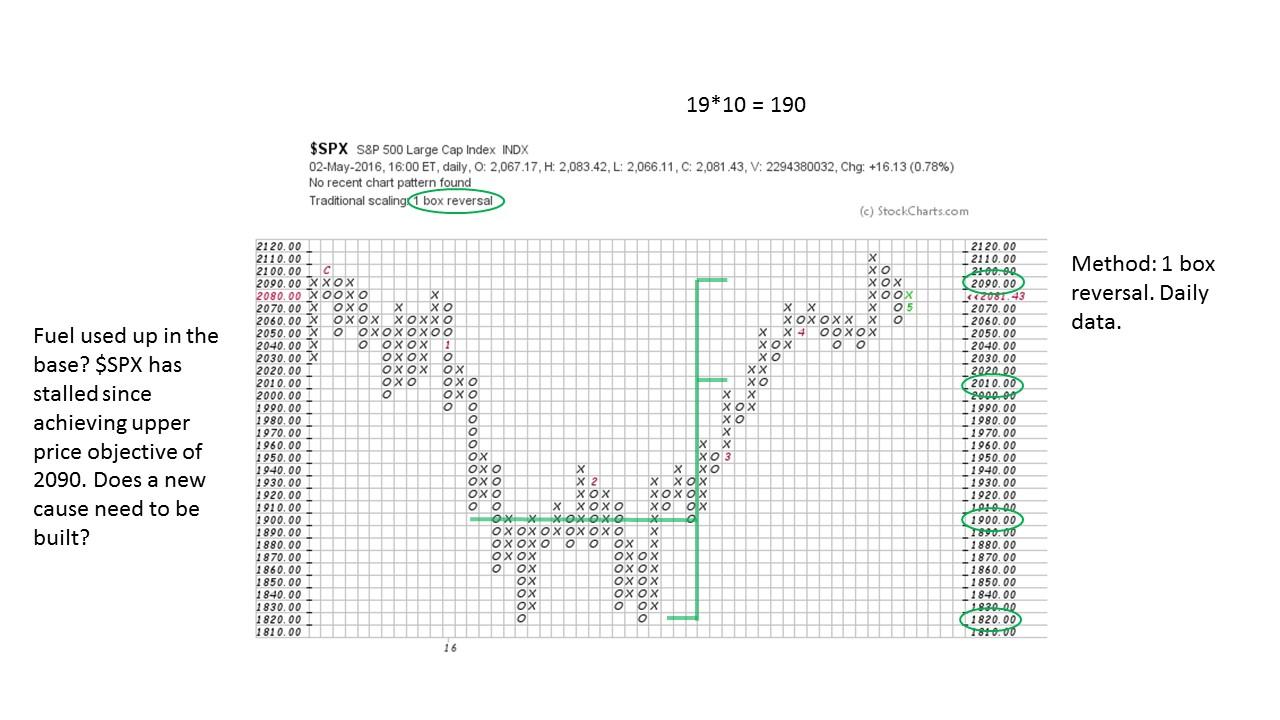
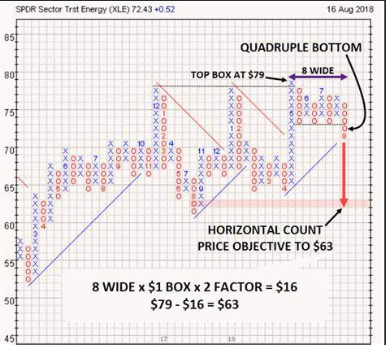
One if an image of what a horizontal count looks like on a PNF chart.
The second file is an indicator file for NinjaTrader 8 that was posted on the futures.io trader’s forum given freely to forum members.
https://futures.io/elite-circle/37789-sody-s-point-figure-ninjatrader-8-a-2.html#post692834
Point And Figure counts are done with both horizontal and vertical counts to find future target prices.
Please let me know if the Optuma programmers can include this in the next update.
NT8-SDY-PnF.zip (17.9 KB)
Here are videos of how the PnF indicator works on NinjaTrader 8 and how I think it should also work on Optuma.
Here is the NinjaTrader 8 indicator for download.
https://anonfiles.com/ZcB8yf5do9/NT8_SDY_PnF_zip
NT8-SDY-PnF-1.zip (17.9 KB)
Hi David,
Have you seen the vertical and horizontal counts already in Optuma? Just add them like any other tool, but they only show up when you are on a P&F chart.
Note that there is a small issue with the calculation when looking at a Log P&F - this will be fixed in Optuma 1.6.
We’ve also made some major improvements in the setup of P&F in 1.6.
All the best
Mathew
Thanks Mathew. Is there a video demonstrating those methods?
Hi all,
It has been some time since a post to this thread but I have put my request here because it is all about P&F charts.
I have been trying to use PFSCAN to filter instruments based on my assumption that a good time to start looking for trades is when the P&F chart changes direction on a vertical count (it is a filter not an indicator for entry or exit). In reality I have found this to be a very powerful start, which is why I am persisting with the difficulties.
However, I have a range of problems and I think most of them are all about the settings.
- On some charts the P&F plot disappears years ago despite a perfectly fine candlestick chart. I finally revealed this to be mostly due to box size.
- It seems that the best configuration for me is the “Modern” or maybe the “Classic” configuration.
- Box size is a real pain because it really needs to be specific for each instrument over a varying range of asset prices in a watchlist, difficult I think.
- Despite utilising the “Save settings as default” my P&F settings do not seem to be saved for the next P&F chart in the workbook, even after I have saved the Page layout setup. Frustrating. Optuma keeps reverting to the “Custom” setting.
Questions:
- I would like to reset the default settings I apply for a P&F chart. I don’t seem to be able to do this even when I follow what seems to be a logical sequence.
- I would like to do this for the P&F setup being used for the scan (PFSCAN).
- I would like to be able to save these settings to my page layout, which has 3 charts (candlestick, GMMAs, P&F)
- I would like to know the reversal criteria being used for PFSCAN (which I believe scans for a reversal of red/green on the chart)
- Is it possible to insert more flexibility into an automatically adjusted box size based on price?
I know that’s all a fair bit to deal with. Sorry about that. I am so close to having the system I desire and this is all that is standing in the way.
Cheers,
Bill Miles