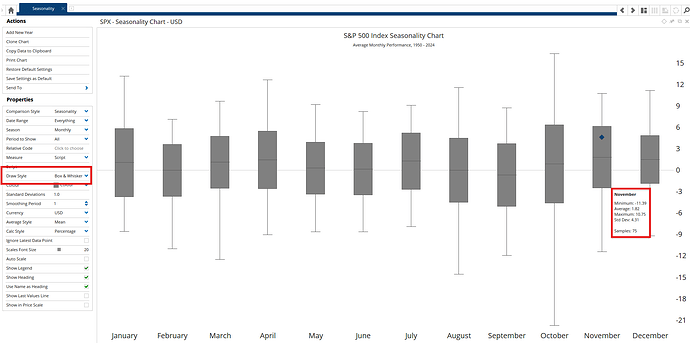
I would like to look at annual volatility and maximum peak to trough by asset and the Seasonality Chart seems like an elegant way to accomplish this.
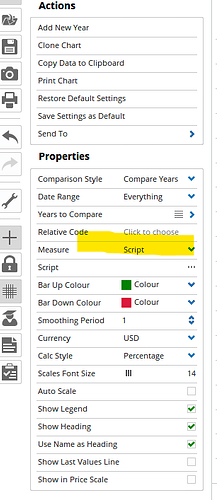
I see a script section within the left-pane menu, but I do not see way to access scripts. The online Seasonality Chart documentation does not mention this. Is it possible to accomplish this directly within the Seasonality Chart?
Thanks,
Eric

