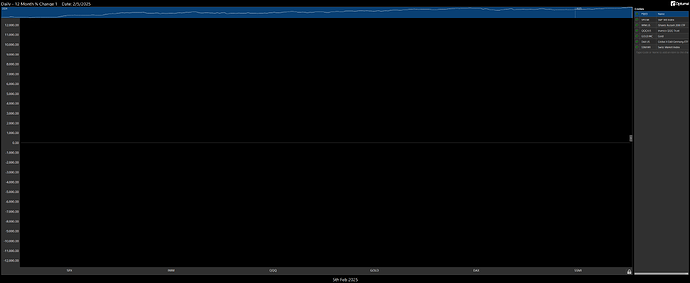
I was looking to create a simple Market Intelligence chart that compares the latest 12 month returns of several asset classes using the below as my script criteria.
//Percentage Change over the last 12 months must be positive
CHANGE(INT_TYPE=Year, INT_COUNT=1) > 0
However, no data populates. I know I am doing something basic incorrectly, but not sure what that is.
Thank you in advance for the assistance.
Eric
